

May 2024 - Walking the Dog
By: Kyle McBurney, CFP
Managing Partner at Highland Peak Wealth

Our first “child" is Winnie, a now nine-year-old goldendoodle who remains remarkably well-behaved amidst the chaos of the McBurney household. Despite being a beloved family member, poor Winnie seldom receives mention in this newsletter and has been noticeably absent from our family holiday photos. Herding young children for a photo is challenging enough; adding a dog to the mix is practically impossible. We learned this lesson the hard way.
Now, why do I bring up Winnie? Well, during a recent walk during April's market sell-off, I couldn't help but reflect on an old Wall Street analogy—the dog and the dog walker. This analogy is helpful in various ways, but one version has always struck a chord with me.
Picture this: the dog walker strolls along with measured steps, seemingly on a straight path at a moderate pace. Meanwhile, our furry friends, like Winnie, have their own agenda. With Carpe Diem-like energy and curiosity for life, they dart from one scent to the next, chasing squirrels and exploring every nook and cranny.
In this analogy, the dog represents the stock market's short-term volatility, while the dog walker embodies the stable, reliable long-term trend. So, if you find yourself fixated on the dog's every move, you might lose sight of the bigger picture. After all, per Ritholtz Wealth Management, the stock market has averaged a solid 10.1% return over the past 30 years, spanning through crashes, bubbles, pandemics, and recessions. It's a gentle reminder that sometimes when we "zoom out," investing looks like an easy game.
Like an excitable pup, markets in April were all over the place. On the final trading day of April, the S&P 500 and tech-heavy Nasdaq suffered a deep drop, culminating in a total monthly loss of 4% for both benchmarks. This past month marks one of the toughest Aprils in over 40 years, only outpaced by the challenges seen in 2012 during the U.S. debt downgrade and the early stage of the Euro-area debt concerns. Despite enjoying a gain of nearly 10% in the first quarter of 2024, these recent stock market declines erased a sizeable chunk of the gain and have led to speculation about whether April's downturn might signal the beginning of something more sinister.
We mentioned this in last month's Trail Guide, and it bears repeating:
Investors would do well to remember the market's inherent ebb and flow. Since 1930, according to Bloomberg, the S&P 500 has averaged a 5% decline over three times a year. After a spirited six-month rally, a pullback or breather wouldn't be out of the ordinary. Of course, this is not a signal to sell but rather a healthy reminder amidst recent market jubilation.
After a furious run-up from last fall, fueled partly by rate-cut optimism, a market pullback was certainly on our radar. Of course, every market pullback—even the "standard" and "overdue" ones—comes with legitimate concerns. However, not all market declines require heroic action or portfolio shifts. Often, attempting to sidestep these fluctuations can cause more damage than the declines themselves. When markets got volatile, the founder of Vanguard, Jack Bogle, would say to investors, "Don't just do something; sit there!"
As in the previous month, we continue to manage portfolios with a balanced approach, maintaining a modest reserve of liquid assets yielding 5% or more. This cash buffer positions us well to respond to shifts in interest rates or to seize more compelling investment opportunities as they arise. We always keep a sharp eye on market movements and trends, ensuring that our investment decisions align with your long-term financial goals and risk tolerance. We hope you enjoy this month's iteration of The Trail Guide.
April Recap
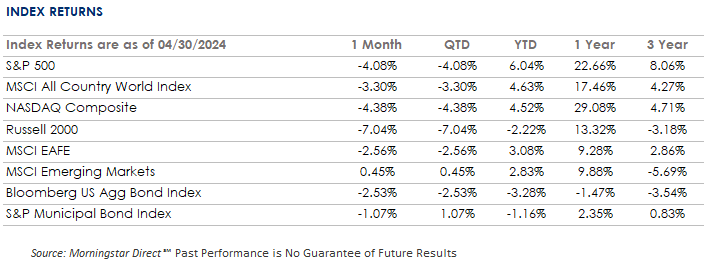
In April, the U.S. stock market faced its most challenging month in 2024, with the S&P 500 experiencing declines in 10 of its 11 sectors—these were the sharpest monthly percentage drops seen this year. The Utilities sector managed to post a slight gain, standing out as the lone exception. The S&P 500 and Nasdaq Composite declined by 4.1% and 4.4%, respectively, marking their first monthly losses since October of the previous year. Additionally, the Dow Jones Industrial Average fell by 5%, its steepest drop since September 2022.
In the realm of fixed income, bonds are still grappling with rising interest rates. Since the beginning of the year, as reported by Jurrien Timmer at Fidelity, the yield on the 10-year Treasury has increased by nearly 1%. The 2-year yield, often viewed as an indicator of future Federal Reserve actions, rose from 4.15% in January to approximately 5%. This is remarkable but, in our view, predictable following the market’s unrealistic expectation three months ago that the Fed would cut rates six times in 2024.
Like a dog smelling a new scent, markets continue recalibrating for a “higher for longer” environment. While the month also included some mixed quarterly earnings performances, notably Meta, as well as heightened tensions in the Middle East, markets continue to be driven by the Federal Reserve and interest rate expectations. Two notable reports came out in April: the March CPI and first-quarter GDP.
1) March CPI Report

Source: U.S. Bureau of Labor Statistics
Data as of April 10, 2024
For the third month in a row, the March Consumer Price Index report came in hotter than anticipated. Markets are sniffing a trend that they don't like. As reported by the U.S. Bureau of Labor Statistics, inflation rose by 3.5 percent on a year-over-year basis. March's reading is also above the expectation of a 3.4% gain. The rise in March was primarily boosted by the shelter and energy components, which drove over half of the headline gain.
2) Q1 GDP Report
Gross domestic product, a broad measure of goods and services produced in the January-through-March period, increased at a 1.6% annualized pace, well below the expectation of 2.4%. It is a softer number, but GDP can sometimes be funky about how it calculates inventories and exports. In some months, these cyclical categories add; in others, they detract. Either way, looking deeper, the inflation-related components of the report tell a more impactful and noteworthy story.
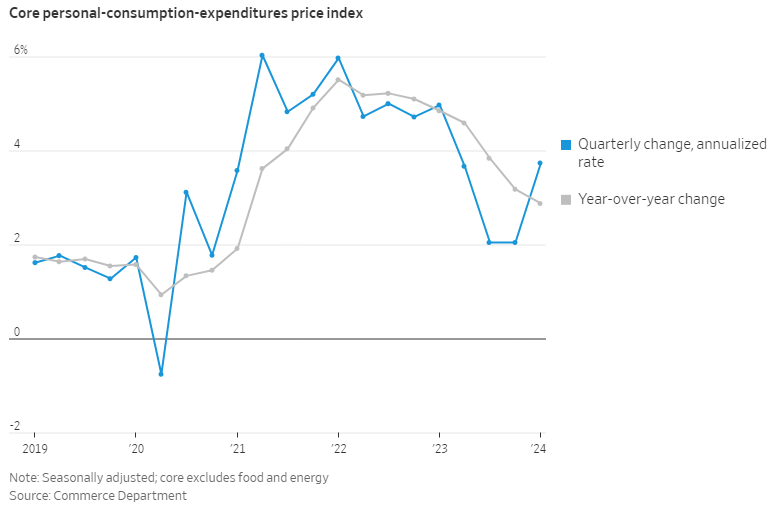
In the March release, the Commerce Department reported that core personal consumption expenditures (PCE) rose by a 3.7% annualized rate during the first quarter, a surprisingly high number, and well above economists' expectations of a 3.4% gain.
These two reports, when considered together, present a challenging scenario for the Federal Reserve to justify a rate cut. The market sentiment has transitioned from speculating about the timing of rate cuts to questioning their likelihood, with some even pondering if we will witness any cuts in 2024.
So, what happens if we don't get rate cuts this year?
Let's take a look.
The Stock Market and Higher Rates
As investors adjust to the reality that the Federal Reserve may not lower rates in 2024, there's a growing interest in understanding how stocks have historically performed during periods of elevated interest rates.
Can stocks thrive with higher interest rates?
The simple answer is yes.
History tells us to remain calm and paints a surprising story. Looking back, some of the best stretches of S&P 500 performance have coincided with higher interest rates. The way that markets traded in April, one would assume the exact opposite. Below is an excellent chart from BMO that illustrates this concept.
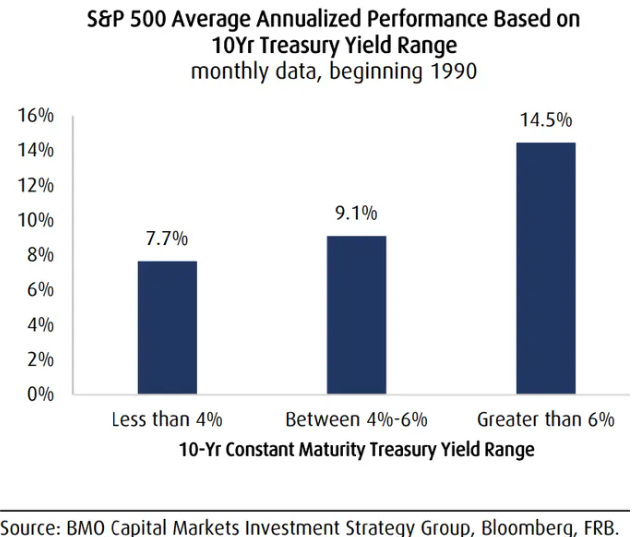
The above chart details the average returns of the S&P 500 correlated with the yield on the 10-year Treasury Bond since 1990. Notably, in the 4% to 6% yield range—our current scenario—the returns are quite favorable. It's a fascinating graphic highlighting counterintuitive results, likely surprising many investors who naturally assume the opposite.
Some of the best stock market periods occurred in times of higher rates. The ‘90s stock market boom coincided with a 10-year Treasury yield north of 6%. While not reflected, the late ‘50s and early ‘60s, a fantastic analog to today's market, produced fantastic returns with rates very similar to those experienced today.
To be clear, there is no direct correlation between higher rates and better stock returns—many factors come into play—but this historical data should alleviate fears that higher rates spell inevitable doom. After all, lower rates have, until recently, been reserved for "emergency" purposes.
Over the past year, our team has been cautious about the prospects of rate cuts. Our February newsletter expressed our skepticism as we examined the phrase "having your cake and eating it too." Today, we see signs of an economy that doesn't need Fed support, given stocks just a few percentage points away from all-time highs, low unemployment, and rising housing prices.
This leads me to ask a question you don't hear much about on CNBC or Bloomberg: Why are we so infatuated with lower rates?
Allow me, if you would, to provide my own editorial opinion on the matter. Why isn't a 4% or 5% 10-year Treasury, where we stand today, a world preferable to a 0% interest rate environment?
In today's conditions, where savers and income-focused investors can earn more, higher rates require more prudent capital allocation, and the economy isn't running on a sugar high. Also, today's rates are far from uncharted territory and are more in line with the historical average. As a risk manager, today's rates give us options for income and return (remember TINA?) that haven't existed for 15 years—a vital improvement for a well-diversified portfolio.
Regardless of our views on the matter, we are closely monitoring these developments, especially as they impact different segments of client portfolios.
Currently, small-cap stocks are underrepresented in our portfolios. This strategic choice reflects smaller companies' challenges in the current rate environment due to their sensitivity to rate changes and higher interest payments. In contrast, larger companies typically find it easier to raise capital and structure debt, which better positions them in a high-rate landscape. If we begin to see rates fall, we may look to increase small-cap exposure. Until then, we continue to prefer larger companies over small ones.
Looking Ahead into May
After April's decline, the old Wall Street saying, "sell in May and go away!" might seem timely. This ol' Wall Street adage reflects the notion that the market typically underperforms from May through October. While it's a catchy rhyme and perhaps true before the advent of computers, it isn't notably accurate.
Contrary to this old wisdom, historical data paints a more optimistic picture for May. Tom Lee of Fundstrat Global Advisors highlights that May has been a strong month for stocks:
May has shown positive returns 77% of the time.
Following a positive first quarter and a negative April, May has been positive 83% of the time.
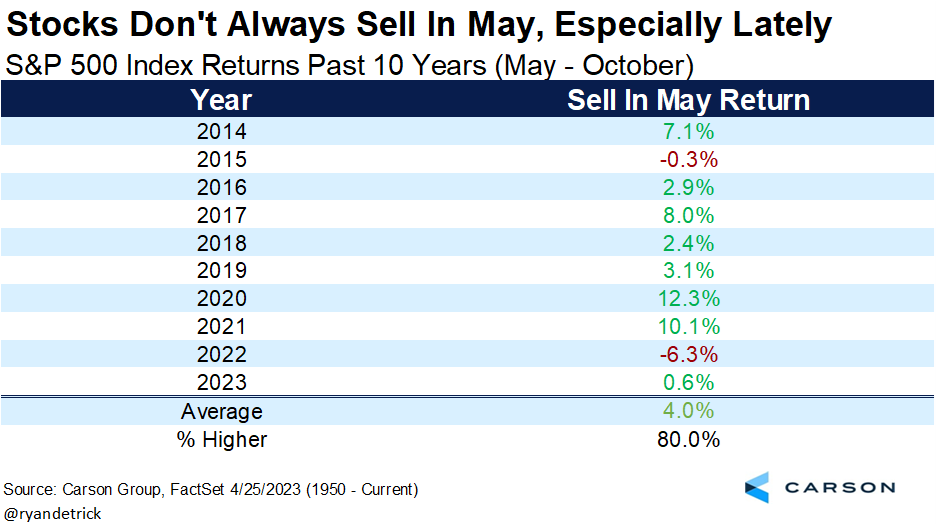
Recent trends suggest even stronger performances in May. Ryan Detrick from Carson Group provides a chart that underscores the solid returns seen in recent Mays.
Tweet (X) of the Month: Better days ahead?
This quote came from John Furner’s interview with ABC News on April 25. Furner, the President & CEO of Walmart U.S., closed the interview with the following quote, “I’m feeling much better about inflation in terms of pricing versus a year ago, but we are not finished.”
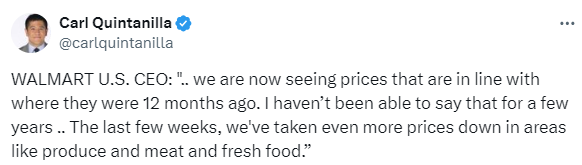
Chart of the Month – Is The News is Making Us Miserable?
Credit goes to Ben Carlson at Ritholtz Wealth Management for highlighting a recent Gallup poll. This poll shows that while our "personal" satisfaction has slightly decreased, it remains close to the historical average. On the other hand, satisfaction with the state of the U.S. is notably low. This discrepancy raises an interesting question: Is the 24-hour news cycle contributing to our discontent? It's worth considering that the human brain lacks the wiring to handle a relentless barrage of negative headlines and global events. Also, we all know the unfortunate truth that negativity sells.
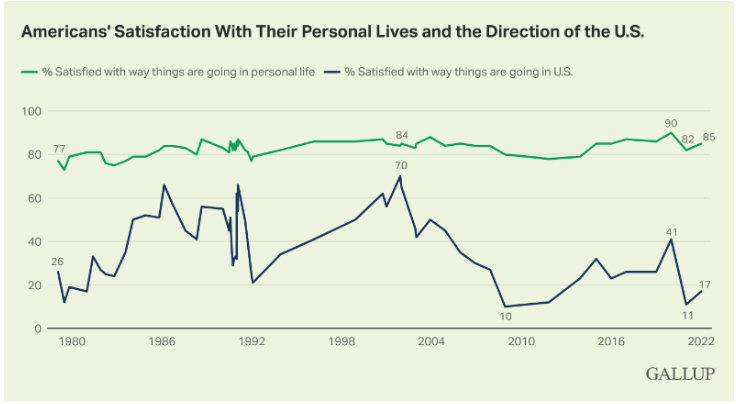
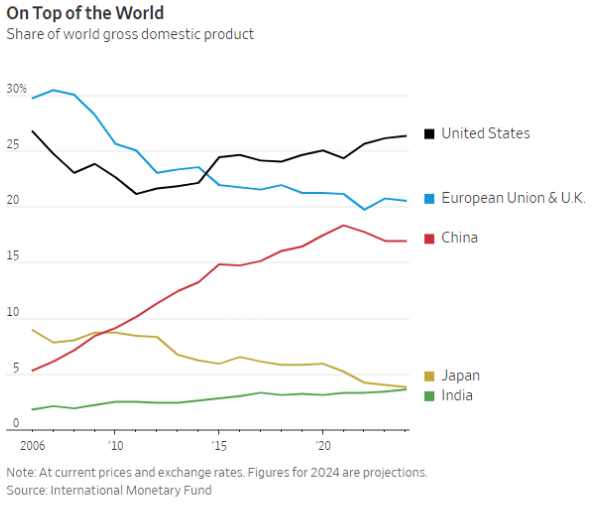
Chart of the Month #2 – A Bit of U.S. Positivity
Allocation Update -
Our investment outlook remains consistent with our stance from last month. The themes we have focused on—AI, Tech, Japan, and India, to name a few—continue to play an important role in today’s markets while providing above-benchmark returns.
Despite April’s volatility, markets have continued to remain resilient. The substantial trillions of dollars still parked in cash reserves can potentially act as a cushion for equity prices in the event of a downturn. According to industry tracker Crane Data, there is around $6.5 trillion in money market funds. And, as history supports, buying the dip in an election year has typically served investors very well. If history repeats itself, we may get the dip we seek in the late summer.
As always, here’s a snapshot of our current outlook:
Equities – Balanced Approach:
U.S. Stocks Preferred: Our inclination continues towards U.S. equities over international markets.
Large Over Small: As discussed earlier in the newsletter, we prefer large cap stocks over small until we see rates begin to fall.
Developed International: While the Eurozone remains underwhelming, we have become more focused in Japanese equities.
Emerging Markets: We maintain a selective approach, with an increasing focus on Indian markets (outperforming emerging benchmark by 6% per Koyfin)
Fixed Income – Slightly Underweight (with increased focus):
Long-Term Bonds: We continue to seek longer-term bonds to lock in the higher yields currently available. This will increase if rate cuts become evident.
Floating Rate Bonds and CLOs: Our outlook remains positive for these options, offering attractive yields and returns and hedging against higher rates.
Alternatives – Slightly Underweight
Gold Overweight: As with stocks, Gold had a strong ’23 and is off to a strong start in ’24 (up 12.83% in ’24 per Koyfin).
Growing Interest in Private Alternatives: More on this later, but our team expects to utilize private investments, such as Private Credit and Private Equity, in a more meaningful way moving forward.
Cash – Getting Closer to Neutral
Strategic Use of Cash: Our strategy involves using this excess cash to seize market opportunities in fixed income or equities.
As our loyal readers know, I often conclude with updates about the McBurney family—always a highlight for those who've told me you skip straight to the end for the "good stuff." However, I'm excited to shift focus from our family to our Highland Peak Family.
Earlier this month, we were thrilled to welcome Santo Dimino into our humble group. Santo joins us from Windsor Private Wealth, where he worked closely with high-net-worth investors and families. We are lucky to have him. For those of you who still need to meet Santo, prepare to be impressed. He speaks four languages, travels, cooks, and flies down mountains on bikes and skis; he is “the most interesting person in the world” and a true polymath. However, his deep passion for this industry and his clients is even more impressive. Troy and I felt it right away. Santo's aim as Wealth Director is to expand our reach and enhance the level of service and experience, we provide to you, our valued clients. We hope you all get a chance to meet Santo soon.
To close, here is a timely quote from the late, great Robin Williams:
"Spring is nature's way of saying, 'Let's party!'"
As always, thank you for your support and readership.
Happy Mother's Day to all!
Kyle M. McBurney, CFP®
Managing Partner
CRN202705-6471025
The opinions expressed herein are those of Kyle McBurney, CFP as of the date of writing and are subject to change. This commentary is brought to you courtesy of Highland Peak Wealth which offers securities and investment advisory services through registered representatives of MML Investors Services, LLC (Member FINRA, Member SIPC). Supervisory office: 280 Congress Street, Boston, MA 02210. (617)-439-4389. Highland Peak Wealth is not a subsidiary or affiliate of MML Investors Services, LLC or its affiliated companies. Past performance is not indicative of future performance. Information presented herein is meant for informational purposes only and should not be construed as specific tax, legal, or investment advice. Although the information has been gathered from sources believed to be reliable, it is not guaranteed. Please note that individual situations can vary, therefore, the information should only be relied upon when coordinated with individual professional advice. This material may contain forward looking statements that are subject to certain risks and uncertainties. Actual results, performance, or achievements may differ materially from those expressed or implied. This material does not constitute a recommendation to engage in or refrain from a particular course of action. Referenced indexes, such as the S&P 500, are unmanaged and their performance reflects the reinvestment of dividends and interest. Individuals cannot invest directly in an index.
Glossary of Index Definitions
Indexes are unmanaged, do not incur fees or expenses, do not reflect any deduction for taxes, and cannot be purchased
directly by investors.
The S&P 500® Index is a widely recognized, unmanaged index representative of common stocks of larger capitalized U.S. companies.
The S&P Muni Bond Index is a broad, market value-weighted index that seeks to measure the performance of the U.S. Municipal bond market.
Dow Jones Industrial Average is a price-weighted average of 30 actively traded Blue Chip stocks, primarily industrials, but also including other service-oriented firms; may be used as a benchmark for large cap stocks
NASDAQ Composite is a broad-based index of over 3,000 companies, which measures all domestic, and non-U.S.-based common stocks listed on the NASDAQ Stock Market, Inc.
The NASDAQ 100 U.S. Index is a composed of the 100 largest, most actively traded U.S. companies listed on the Nasdaq stock exchange.
The Russell 2000® Index is a widely recognized, unmanaged index representative of common stocks of smaller capitalized U.S. companies.
The MSCI EAFE Index is a widely recognized, unmanaged index representative of equity securities in developed markets, excluding the U.S. and Canada.
The MSCI Emerging Markets (EM) Index is an unmanaged market capitalization-weighted index of equity securities of
companies domiciled in various countries. The Index is designed to represent the performance of emerging stock markets
throughout the world and excludes certain market segments unavailable to U.S.-based investors.
The MCSI All Country World Index (ACWI) captures large and mid cap representation across 23 Developed Markets and 24 Emerging Markets.
The Barclays U.S. Aggregate Bond Index is a broad measure of the U.S. investment-grade fixed-income securities market.
The Bloomberg U.S. Aggregate Bond Index is an unmanaged index of fixed-rate investment-grade securities with at least one year to maturity, combining the Bloomberg U.S. Treasury Bond Index, the Bloomberg U.S. Government-Related Bond Index, the Bloomberg U.S. Corporate Bond Index, and the Bloomberg U.S. Securitized Bond Index.
The Nikkei Index is a price-weighted index composed of Japan’s top 225 blue-chip companies traded on the Tokyo Stock Exchange.
©2023 Morningstar, Inc. All Rights Reserved. The information contained herein: (1) is proprietary to Morningstar and/or its
content providers; (2) may not be copied or distributed; and (3) is not warranted to be accurate, complete or timely. Neither Morningstar nor its content providers are responsible for any damages or losses arising from any use of this information
