April 2024 - Run Forrest, Run!
By: Kyle McBurney, CFP
Managing Partner at Highland Peak Wealth

Like Tom Hanks in Forrest Gump, this market keeps running and smiling.
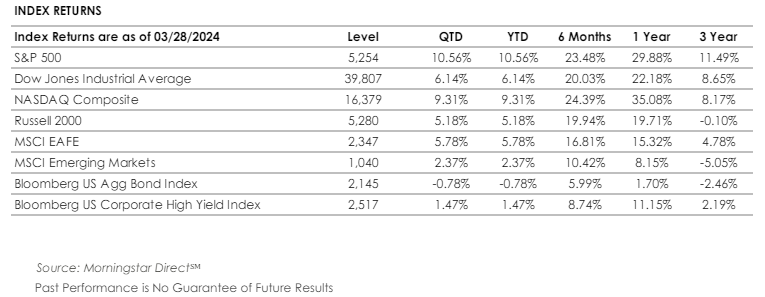
A holiday-shortened week concluded a marvelous month, quarter, and start to the year for markets. Unsurprisingly, U.S. stocks continue to lead the way. Per Morningstar Direct, the S&P 500 rallied 3.2% in March and 10.6% for the quarter—the best start since 2019—as positive momentum continued from last year's strong finish. March's gain makes it six straight months of market expansion.
The bond market over the past quarter was relatively stable, but we saw some interest rate shifts. The interest rates for medium and long-term investments climbed slightly, by about half a percent over the three-month period. The U.S. Aggregate Bond Index, which gives us a good overview of the bond market, increased by 0.9% in March. However, if we consider the entire quarter, it decreased slightly by 0.8%.
So, what do we make of this year's fantastic start for stocks? First, let's appreciate where we are and where we have been. We should be pleased with the economy's resilience in the face of higher inflation. This can change quickly, of course, but the economy has thus far staged an Ocean's Eleven-esque escape from high inflation and recession.
But, after a six-month rally, can these markets keep going? As usual, it depends on whom you ask.
Market bulls like JPMorgan's chief market strategist, Marko Kolanovic, still see plenty of optimism. For one, artificial intelligence (AI) advocates argue that tech companies are poised for ever more growth and higher profit margins. Historical patterns suggest that strong first quarters, especially in presidential election years such as this one, bode well for annual performance. If that isn't enough, anticipated Federal Reserve rate cuts, potentially totaling three quarter-points by year-end, could further fuel the stock market's upward trajectory.
Conversely, cautionary voices like David Kostin of Goldman Sachs warn of an overvalued market on the brink of a correction. With the market's price-to-earnings (P/E) ratio surpassing five and ten-year averages, there's pressure on companies to significantly boost profits in 2024 simply to justify these valuations.
Interestingly, bullish sentiments seem to be overpowering more bearish outlooks, nudging consensus towards a bold "damn the torpedoes" type of optimism. It always gives us pause when the talking heads are prominently positioned in one direction or another. The famous quote from General George S. Patton comes to mind – “if everyone is thinking alike, then someone isn't thinking.”
Investors would do well to remember the market's inherent ebb and flow. Since 1930, according to Bloomberg, the S&P 500 has averaged a 5% decline more than three times a year. After a spirited six-month rally, a pullback or breather wouldn't be out of the ordinary. Of course, this is not a signal to sell, but rather a healthy reminder amidst recent market jubilation.
Looking ahead, we are happy to manage portfolios in a balanced manner with some dry powder (still earning 5% or more) as we wait for additional direction around rates and earnings. Echoing Warren Buffett's wisdom, there's no obligation to act hastily; investors, unlike your favorite baseball player (happy opening day!), have the luxury of patience and time. We don’t have to swing at pitches we don’t like. As always, our approach is rooted in a thorough analysis of market fundamentals and trends, aiming to align our investment strategies with your long-term goals and risk tolerance. We hope you enjoy this month’s iteration of The Trail Guide.
A Review of the First Quarter
As we bid adieu and shout a hearty thank you to the first quarter of 2024, let's take a closer look at the numbers and narratives that shaped global markets. While the U.S. stock market often dominates the headlines, it's important to recognize that global stocks have also delivered positive returns.
A Global Perspective on Equities:
While the U.S. stock market often commands the spotlight, it's crucial to acknowledge the broader global landscape. The MSCI ACWI Index, our barometer for worldwide equities, notched an impressive 8.2% gain in Q1, buoyed by easing inflation worries. Central banks around the globe hinted at potential rate cuts, stirring hopes for a gentle economic descent, or what's often termed a "soft landing," invigorating investor spirits.
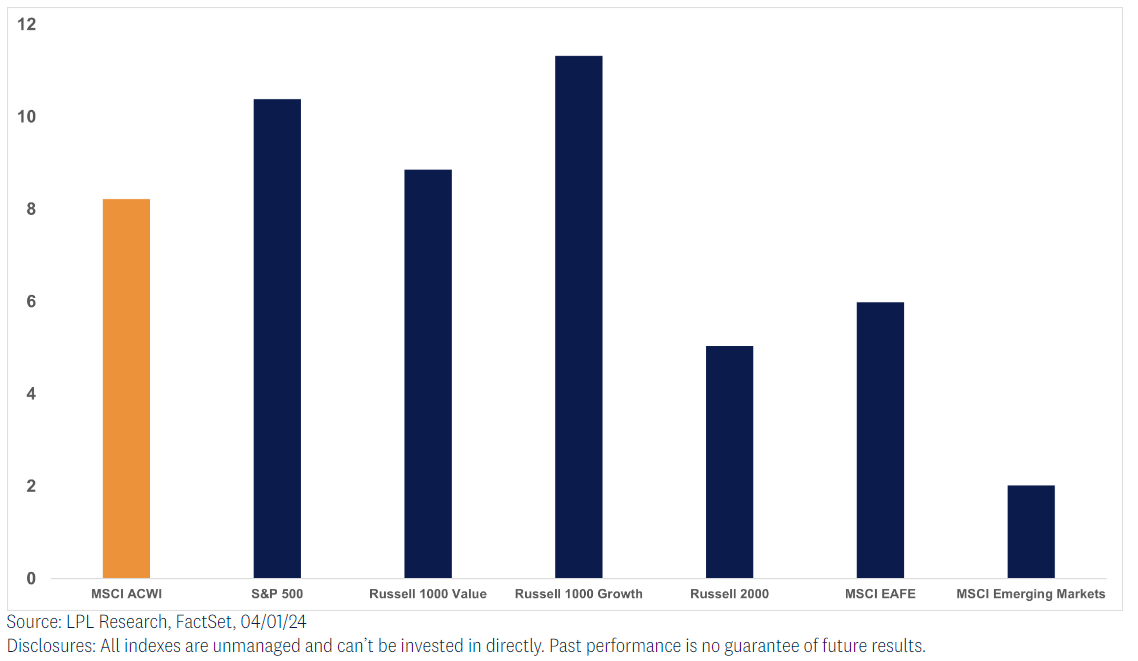
Internationally, the narrative differed. The MSCI EAFE Index, which includes developed markets outside of North America, rose by a solid 6.0% in Q1, with Japan notably contributing to this growth. Emerging markets encountered some turbulence, particularly China, impacting the broader index. However, India stood out as a beacon of strength -- gaining 6.5% in Q1 according to Morningstar Direct -- signaling the country’s intriguing growth potential.
The Bond Landscape:
As mentioned earlier in this newsletter, the journey has been less rosy for bonds. The Bloomberg U.S. Aggregate Bond Index dipped 0.8% in the first quarter, marking its sixth straight quarter in the red. Despite this, there are silver linings. Attractive yields persist, offering opportunities for income-oriented investors. Moreover, the looming prospect of interest rate cuts remains on the horizon, although our team maintains a cautious stance given the robust economic data and upward trajectory of jobs numbers. More on this a little bit later.
The Home Front: U.S. Equities Shine:
Keeping recent traditions alive, U.S. stocks continue to be the main attraction.
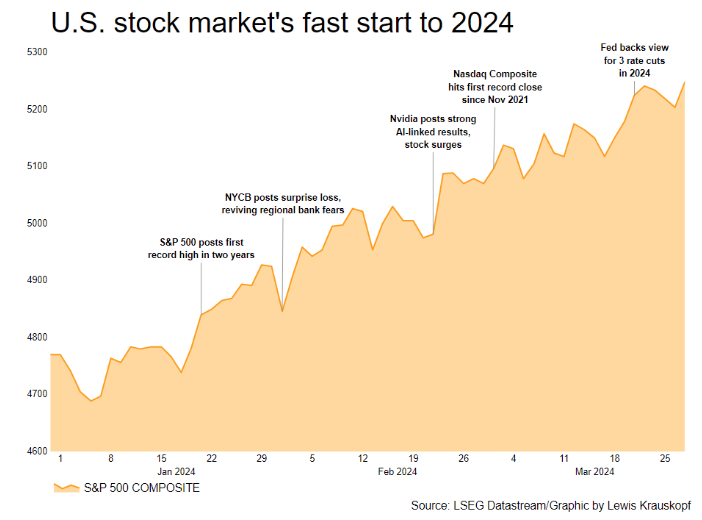
The S&P 500 surged 10.2%, its most impressive first-quarter leap since 2019, continuing its upward trajectory from the previous year.
Even more impressive, and appreciated, is the lack of volatility. As you can see below, it has been a steady climb higher for U.S. stocks, with minimal pain along the way. So far, this has been one of the rare instances where the largest “pullback” is less than treasury yields. With an election ahead, history says that will likely change.
The tech-driven Nasdaq followed closely with a 9.1% gain, while the Dow Jones Industrial Average saw a respectable 5.6% rise as reported by Bloomberg.
Small caps, as seen through the Russell 2000, lagged slightly with a 5.0% gain. Though smaller companies haven't kept pace with their larger counterparts, their potential is bright, given the increasing optimism around economic growth the potential for rate cuts. Any reduction in interest rates will benefit smaller companies who are more exposed to variable loans.
Style Spotlight: Growth vs. Value:
In the perennial battle between growth and value stocks, growth once again claimed the crown. The Russell 1000 Growth Index surged 11.3%, outshining the Russell 1000 Value Index, which posted a respectable 8.9% gain. Growth's dominance stemmed from the usual suspects – tech giants leading the charge in AI.
From the Magnificent Seven to the Final Four
It appears that markets are also getting into the spirit of tournament basketball and the final four.
Last year, the Magnificent Seven -- those tech giants leading the AI revolution -- dominated the scene. This year? Not quite the same story is unfolding as a few members of this group are starting to fizzle. The other four – the final four – continue their amazing rally. These four stand outs are responsible for nearly half of the S&P 500’s first-quarter advance, according to Howard Silverblatt, senior index analyst at S&P Dow Jones Indices. Nvidia, as highlighted in last month's newsletter, remains a standout performer.
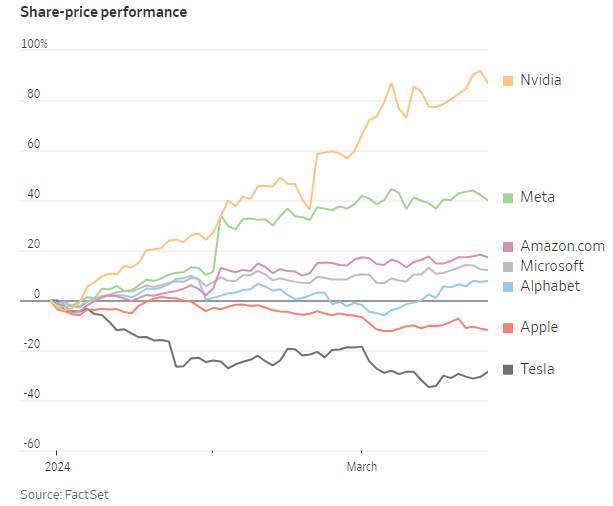
However, it's not all smooth sailing. Apple and Tesla, usually heavy hitters in the S&P 500, have stumbled out of the gate this year. Google is making a comeback but still trails the index. Tesla's struggles are particularly noteworthy, with the stock plummeting nearly 30% amid intensified competition from China and EV price cuts.
These struggles make this year’s 10% gain for U.S. stocks even more impressive. Unlike last year, when any hint of weakness in the Magnificent Seven sent markets into a tailspin, we're now witnessing a broader rally with more market participants jumping in. Beyond the tech realm, sectors like homebuilders, construction companies, and energy are making noteworthy gains, showcasing an improved diversification in market leadership.
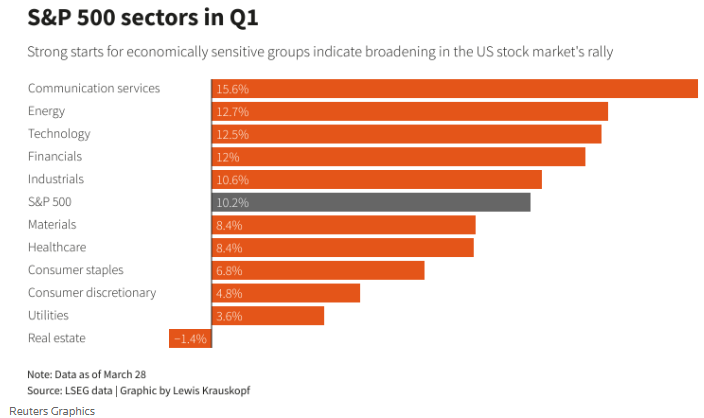
This improved diversification in market leadership is welcome, and something we will keep an eye on.
This broader enthusiasm is tied to hopes that the economy has escaped a deep recession and that the Federal Reserve will soon start cutting interest rates. Our team has remained skeptical about this but remains a topic of huge interest to investors in the stock market—and even more so for investors in bonds and cash investments.
Cash vs. Bonds
Bond investors find themselves in a state of frustration. While stocks have been soaring since the 2022 midterm elections, bond returns have remained stagnant, seemingly stuck in the proverbial mud. Sure, the Barclays U.S. Aggregate Bond Index managed to eke out a 5.53% gain last year, per Morningstar, but let's not forget the agony of 2022. And now, with a disheartening 0.78% decline in the bond index in Q1, 2024 is off to a vexing start.
The question on everyone's mind: When will the paradigm shift? The answer lies with the Federal Reserve. Despite widespread expectations for rate cuts, Jerome Powell and the Fed continue to delay action as stronger-than-expected economic data keeps pouring in. Case in point, March's job numbers, released on April 5th, once again beat expectations, with the economy adding a whopping 303k jobs to an already hardy labor market.
Markets are split with the next rate cut will occur. According to the CME Group’s FedWatch Tool, a program we review regularly, markets have priced out a rate cut in May. Even June remains a coin flip as the market sees only a 50% chance of a rate cut announcement. This is quite a departure from January's anticipation of six or seven rate cuts in 2024.
But when/if rates do eventually fall, bond investors need to be ready. History tells us that bonds thrive in this environment, particularly when compared to cash. Patient investors not only secure higher yields on bonds for years to come but also witness their bond holdings appreciate.
With trillions of dollars of cash sidelined, there's plenty of dry powder waiting to move markets. Since 2022, cash has been a haven, offering stability and attractive yields. However, cash investors should keep a keen eye on interest rate trends. Once the Fed kicks off its cutting cycle, bond returns historically outshine cash returns by a significant margin. Just look at the chart below for a clear illustration of this trend:
Source: J.P. Morgan, Bloomberg Finance L.P., Haver Analytics, Ibbotson, from Tim Andres & Ben Bakkum, U.S. core bonds represented by 50% Bloomberg U.S. Corporate Aggregate Bond Index and 50% Bloomberg U.S. Government Aggregate Bond Index. Data as of December 2019.
It's no surprise that bonds deliver solid returns during a rate-cutting cycle. The analogy of 1995 is particularly apt, when the Fed slashed rates without a recession in sight, something it hopes to do this time around.
So, what does this mean for fixed income within your portfolio? A couple thoughts:
Shorter maturity bonds and cash alternatives may underperform if the Fed initiates a rate-cutting cycle.
Nonetheless, it's an opportune time to lock in attractive yields before rate cuts kick in (though the potential for zero cuts is on the rise).
Above all else, patience is a virtue. Patient bond investors typically have been rewarded. Historically, early birds enjoyed the strongest bond market returns. Below is another excellent chart from Bloomberg:
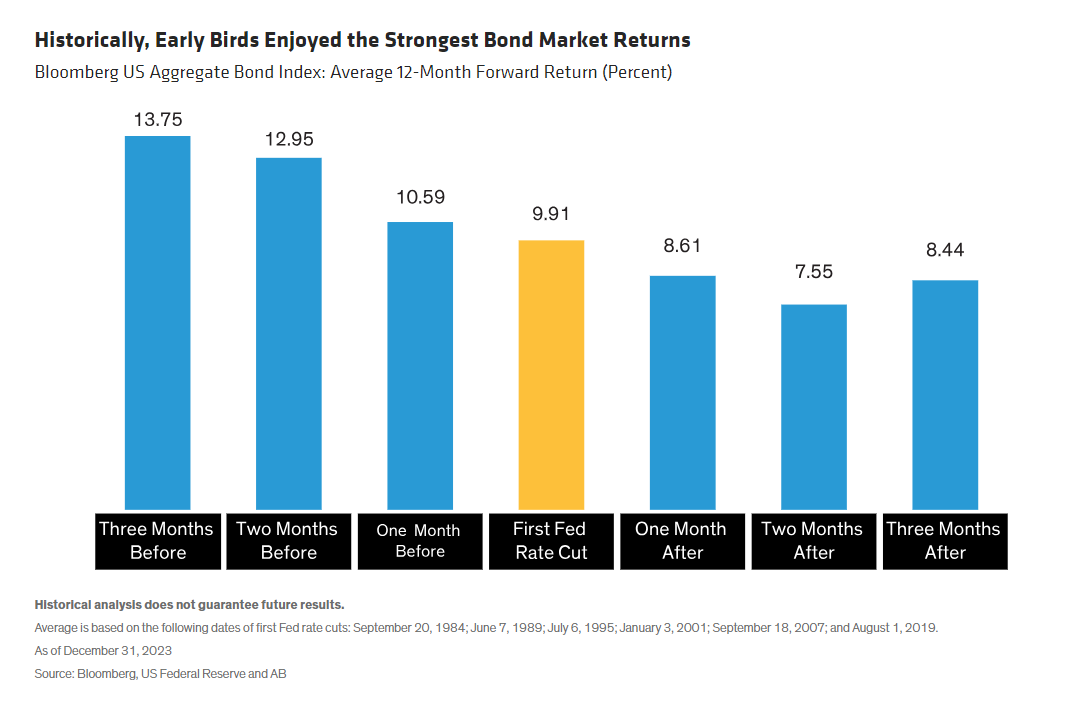
For those frustrated, summon your inner Aristotle: “Patience is bitter, but its fruit is sweet.”
As expected, we will be paying close attention to the upcoming Federal Reserve meetings and press releases.
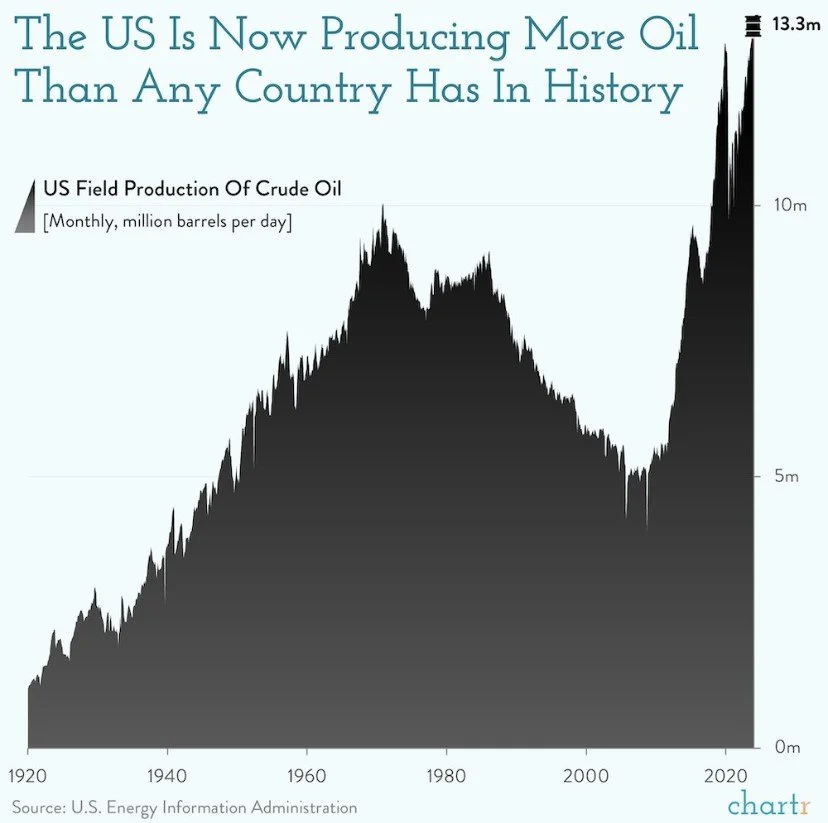
Chart of the Month – No commentary is needed for this intriguing chart, which I just stumbled upon. Regardless of political affiliations or environmental considerations, it's undeniable that shale drilling has been a game-changer in the 21st-century. It has undoubtedly been a transformative force in the energy landscape, shaping economies, geopolitics, and environmental policies around the world.
Allocation Update
Our perspective remains unchanged from last month. After all, it is crucial to maintain a long-term view and not overreact to short-term fluctuations. We would not be doing our jobs properly if we reacted and altered portfolios week in, week out. Also, the themes we have focused on—AI, Tech, Japan, and India—continue to play an important role in today’s markets while providing above benchmark returns.
As mentioned in the early part of this newsletter, a market pullback or pause would not surprise us. This market has been on a tear since last October when the S&P 500 dropped to 4,100, albeit briefly. According to Strategas, the S&P 500 has since rallied 28%, gaining 14 out of the last 16 weeks.
At the same time, we do not see doom and gloom ahead. The substantial trillions of dollars still parked in cash reserves can potentially act as a cushion for equity prices in the event of a downturn. According to industry tracker Crane Data, there is around $6.5 trillion in money market funds. And, as history supports, buying the dip in an election year has typically served investors very well.
As always, here’s a snapshot of our current outlook:
Equities – Balanced Approach:
U.S. Stocks Preferred: Our inclination continues towards U.S. equities over international markets.
Developed International: While the Eurozone remains underwhelming, we have become more focused and interested in Japanese equities.
Emerging Markets: We maintain a selective approach, with an increasing focus on Indian markets (so far, so good).
Fixed Income – Slightly Underweight (with increased focus):
Long-Term Bonds: We continue to seek longer-term bonds to lock in the higher yields currently available.
Floating Rate Bonds and CLOs: Our outlook remains positive for these options, offering attractive yields and returns and hedging against higher rates.
Opportunistic Strategy: With lower returns from cash, we are exploring more strategic opportunities within fixed income.
Alternatives – Slightly Underweight
Gold Overweight: As with stocks, Gold had a strong ’23 and is off to a strong start in ’24 (up 12.83% in ’24 per Koyfin).
Cash – Getting Closer to Neutral
Strategic Use of Cash: Our strategy involves using this excess cash to seize market opportunities in fixed income or equities.
One thing you should know about the McBurney family—we travel. My venturesome wife, Heather, motivates us to stay on the move, seeing the world and visiting friends and family. And let me tell you, having two youngins in tow doesn't slow us down one bit. Repetition is the mother of skill, as they say, with Teddy and Cooper becoming road trip rockstars.
With dinosaur raincoats and dinosaur rainboots packed, the family enjoyed a quick but fun trip to Ireland. In fact, this was our fourth time driving on the left side and seeing the best of the Emerald Isle. From Boston, the flight is easy, the country is beautiful, and the people are charming. Who needs a box of chocolates when you've got Ireland waiting to welcome you with open arms, right, Forrest Gump?
As always, thank you for your support and readership.
Kyle M. McBurney, CFP®
Managing Partner
CRN202704-6283236
The opinions expressed herein are those of Kyle McBurney, CFP as of the date of writing and are subject to change. This commentary is brought to you courtesy of Highland Peak Wealth which offers securities and investment advisory services through registered representatives of MML Investors Services, LLC (Member FINRA, Member SIPC). Supervisory office: 280 Congress Street, Boston, MA 02210. (617)-439-4389. Highland Peak Wealth is not a subsidiary or affiliate of MML Investors Services, LLC or its affiliated companies. Past performance is not indicative of future performance. Information presented herein is meant for informational purposes only and should not be construed as specific tax, legal, or investment advice. Although the information has been gathered from sources believed to be reliable, it is not guaranteed. Please note that individual situations can vary, therefore, the information should only be relied upon when coordinated with individual professional advice. This material may contain forward looking statements that are subject to certain risks and uncertainties. Actual results, performance, or achievements may differ materially from those expressed or implied. This material does not constitute a recommendation to engage in or refrain from a particular course of action. Referenced indexes, such as the S&P 500, are unmanaged and their performance reflects the reinvestment of dividends and interest. Individuals cannot invest directly in an index.
Glossary of Index Definitions
Indexes are unmanaged, do not incur fees or expenses, do not reflect any deduction for taxes, and cannot be purchased
directly by investors.
The S&P 500® Index is a widely recognized, unmanaged index representative of common stocks of larger capitalized U.S. companies.
The S&P Muni Bond Index is a broad, market value-weighted index that seeks to measure the performance of the U.S. Municipal bond market.
Dow Jones Industrial Average is a price-weighted average of 30 actively traded Blue Chip stocks, primarily industrials, but also including other service-oriented firms; may be used as a benchmark for large cap stocks
NASDAQ Composite is a broad-based index of over 3,000 companies, which measures all domestic, and non-U.S.-based common stocks listed on the NASDAQ Stock Market, Inc.
The NASDAQ 100 U.S. Index is a composed of the 100 largest, most actively traded U.S. companies listed on the Nasdaq stock exchange.
The Russell 2000® Index is a widely recognized, unmanaged index representative of common stocks of smaller capitalized U.S. companies.
The MSCI EAFE Index is a widely recognized, unmanaged index representative of equity securities in developed markets, excluding the U.S. and Canada.
The MSCI Emerging Markets (EM) Index is an unmanaged market capitalization-weighted index of equity securities of
companies domiciled in various countries. The Index is designed to represent the performance of emerging stock markets
throughout the world and excludes certain market segments unavailable to U.S.-based investors.
The MCSI All Country World Index (ACWI) captures large and mid cap representation across 23 Developed Markets and 24 Emerging Markets.
The Barclays U.S. Aggregate Bond Index is a broad measure of the U.S. investment-grade fixed-income securities market.
The Bloomberg U.S. Aggregate Bond Index is an unmanaged index of fixed-rate investment-grade securities with at least one year to maturity, combining the Bloomberg U.S. Treasury Bond Index, the Bloomberg U.S. Government-Related Bond Index, the Bloomberg U.S. Corporate Bond Index, and the Bloomberg U.S. Securitized Bond Index.
The Nikkei Index is a price-weighted index composed of Japan’s top 225 blue-chip companies traded on the Tokyo Stock Exchange.
©2023 Morningstar, Inc. All Rights Reserved. The information contained herein: (1) is proprietary to Morningstar and/or its
content providers; (2) may not be copied or distributed; and (3) is not warranted to be accurate, complete or timely. Neither Morningstar nor its content providers are responsible for any damages or losses arising from any use of this information