November 2023 - Mr. Market Revisited
Kyle McBurney, CFP
Managing Partner at Highland Peak Wealth
It was this time last year when this humble newsletter went viral. Well, not really. But it felt that way.
Staring at a seemingly unending and uniquely painful bear market, we needed to bring our A game. After all, the primary goal of this newsletter has always been to ease the nerves and calm our collective blood pressures.
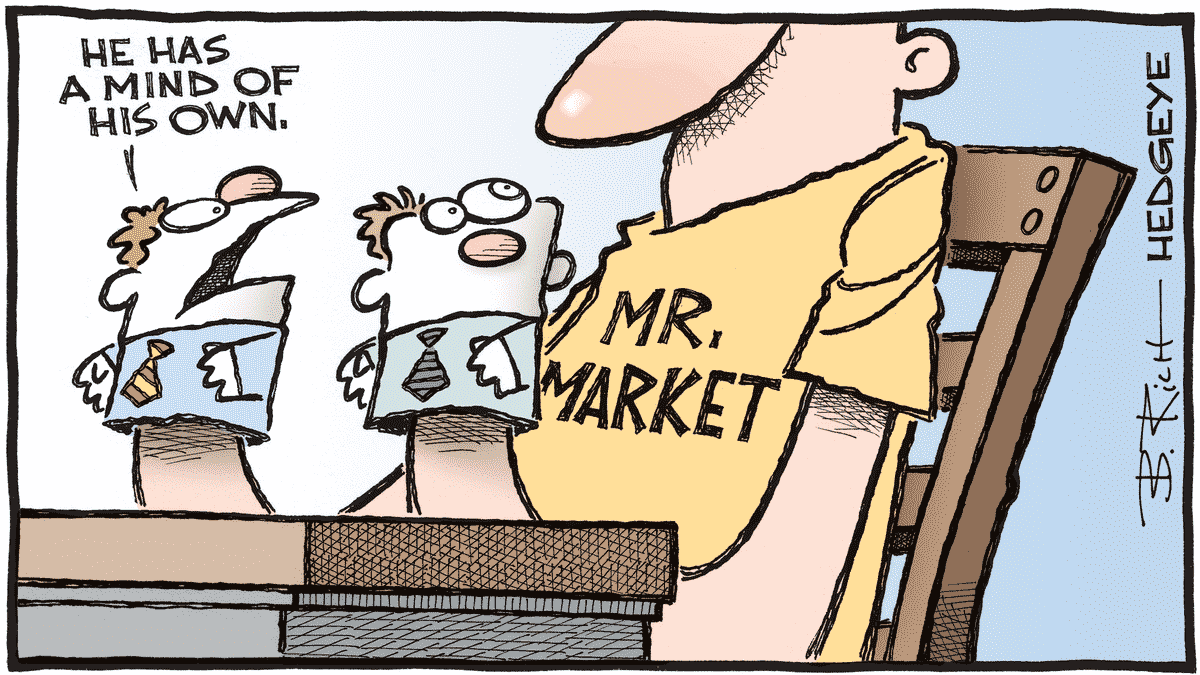
Cue the grand entrance of the erratic Mr. Market.
For new clients or those unfamiliar, Mr. Market is an allegorical, somewhat comical figure introduced by Benjamin Graham in his 1949 book, "The Intelligent Investor," to personify the erratic behavior of the stock market. Described as a temperamental business partner, Mr. Market offers you a price for your shares daily, reflecting his wildly swinging moods—from euphoria to despondency. According to Graham, the key is to ignore Mr. Market's moods and not let them influence your investment decisions. This is a challenge, now more than ever, but crucial for investment success in our ultra-connected world.
Simply put, the Mr. Market story resonated. In a time when the news seemed an endless stream of somber and depressing forecasts, Mr. Market and his lessons brought balance and provided readers with a much needed and sought-after balance.
The newsletter received tremendous feedback and reached thousands more than usual when posted to LinkedIn. Thankfully, my humility and vanity withstood the swell of attention.
Since the newsletter introducing Mr. Market was published, the S&P 500 rose 22.4% per Morningstar Direct. The Nasdaq 100 Index has been even more impressive, up +40%. While the journey has had its turbulence—true to the nature of markets—it's been one of undeniable progress.
This is by no means a victory lap. We're keenly aware that today's triumphs could be tomorrow's painful lessons. But, after yet another bumpy summer and nauseating early fall, the lessons of Mr. Market are as pertinent as ever.
As recent surveys and market positioning confirm, things are about as negative as they have ever been in recent years. As we closed the month of October, negativity was everywhere. The U.S. Consumer Confidence, for example, continues to move levels akin to 2020's depths of COVID gloom. In October, as reported by Goldman Sachs, hedge funds were as light on U.S. stocks as they had been in five years. According to a recent Bank of America Report, investors have also been flocking to cash – pouring in $1.3 trillion into cash funds this year.
As we are on the cusp of 2024, many market concerns still exist. But that will always be the case. There will always be something. Remember those stellar returns of the previous decade? Those came in the face of double-dip recession concerns, downgrades, slow growth, trade wars, and a global pandemic. It was also a period when traditional saving avenues, like savings accounts and treasuries, offered scant rewards.
Looking ahead, the outlook for equity markets remains somewhat concerning – put another way, it looks normal. We acknowledge that questions about interest rates, the U.S. economy's resilience, and geopolitical shocks remain. But we're not in the business of avoiding every storm; we're here to navigate through them together and look for opportunities where they arise. We continue to do our best to cut through the noise and keep the long-term view in mind.
A Look Back at October Returns
As we turned the calendar page over to November, it's worth reviewing market performance in October. The S&P 500 index started strong, then wobbled, and ended with a surge. Overall, the month showed a modest retreat of 2.2%.
Despite this pullback, the broader picture still gives us reasons for optimism. Inflation, though stubborn, has come down from its peak last year, and the U.S. economy has demonstrated a commendable level of resilience. Moreover, it's worth noting that the S&P 500 is still in positive territory year-to-date, up by 9.2%. This is a testament to the underlying strength we've observed in the markets over the past months.
Turning our gaze to the smaller players – the Small and Mid-Cap stocks – the tune changes. More susceptible to the economic and market tremors, these smaller companies have felt the sting of rising interest rates and borrowing costs that have climbed significantly over the past year and a half. October was particularly harsh; Mid-Caps shed 5.42%, dipping into negative territory for the year, while Small-Caps took a 5.83% hit for the month, now down 6.34% for the year.
Globally, stocks also continue to trail U.S. markets. Emerging Markets fell 3.9% and Developed International Stocks (EAFE) lost 4.0%--unsurprising given the terrible events unfolding on the East Mediterranean seaboard.
Rates continue to rise in October, marking the third straight losing month for bonds. The Bloomberg Aggregate bond index fell 1.7% in October as the yield on the 10-year treasury rose to 5% -- the highest level since 2007. It's always wise to remember the seesaw of yields and prices – when one rises, the other falls.
Add it all up: October's decline wasn't fun, but it could have been worse. But here is the good news: November is the best calendar month for stocks, up an average of 1.7% since 1950.
The S&P 500: the best six months (average since 1950)
November - +1.7%
April - +1.5%
December - +1.4%
July - +1.3%
January - + 1.1%
Source: Stock Trader’s Almanac
Even better, December is the third-best month for the S&P 500 – a reminder of year-end seasonality. Below is a reminder of how strong the end of the year typically is for the stock market.
Of course, while market seasonality offers a guide, it's merely a reflection of historical averages. But, if early November trading is any indication, perhaps history has some merit.
As we look ahead and reflect on October, three sections of the market have our interest – small-cap stocks, tech stocks, and the potential for bonds to atone for their recent decline.
Small Cap Frustrations
Diversification means there will always be areas of your portfolio doing better and worse than others. An old saying in our industry is that having a diversified portfolio means always saying you’re sorry. This particularly resonates when discussing small-cap stocks—companies with a market valuation between $250 million and $2 billion.
For what feels like an eternity to us as portfolio managers, these smaller companies have required us to exercise our apologies, given their long-term underperformance relative to their large-cap siblings. Morningstar data underscores this, revealing that over the last decade, the S&P 500 has eclipsed the Russell 2000, a small-cap benchmark, by an average of 5% annually—a significant margin by any standard.
The current year's returns haven't altered the trend. The gap has widened, with large caps overshadowing small caps by an even more striking ~14%. It should be noted that small caps have a heightened sensitivity to economic tremors, particularly the anticipation of a recession and the sting of rising interest rates—both of which are currently top-of-mind and why we now prefer a large cap "tilt" in our portfolios.
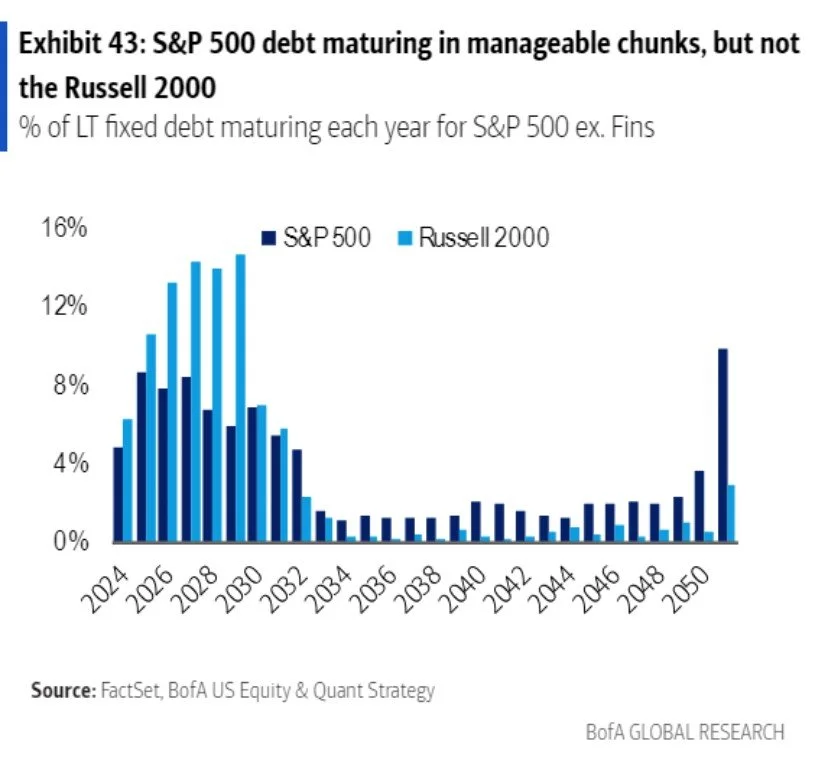
Set forth below is a graphic from FactSet that illustrates smaller businesses vulnerability to short-term interest rate hikes.
While large caps demonstrate a more tempered relationship with debt, small caps face a starkly different scenario. As a small cap company’s debt matures, it finds itself compelled to refinance at prevailing, steeper rates—a painful proposition in today's environment.
Yet, we haven't lost faith. Market trends are cyclical, and significant divergence often leads to a reversion to the mean. Small caps are valued at a 35% discount on forward earnings, compared to large caps, signaling their most attractive pricing since the Covid downturn and the previous decade. While this isn't a singular reason to boost small-cap exposure, it's an important data point to consider as we look for trends and market shifts to act upon. (We are still waiting.)
Tech Stocks – Outsized Returns & Outsized Valuations
Despite October's volatility, the tech sector has maintained its stronghold over this year's market performance. The “Magnificent Seven”—prominent names such as Apple, Microsoft, and Amazon—have clung to their impressive year-to-date advances despite navigating an environment of higher interest rates and mixed third-quarter earnings results.
Yet, unlike their small-cap peers, these tech behemoths continue to carry a hefty price tag. The group's combined market valuation ebbed and flowed in October, reflecting concerns about higher rates and earnings. Although recent market adjustments have dialed down their once-soaring valuations, they still command a significant premium compared to the rest of the market and long-term averages. Below is a chart from Goldman Sachs that demonstrates the recent path and valuation of the magnificent seven:
This chart also accentuates the disparity in valuation between the Magnificent Seven and the rest of the market. It is crucial to remember that market valuations outside these mega-cap tech names appear substantially more grounded and even present a discount relative to historical standards.
The Magnificent Seven are poised to remain in the financial spotlight. After all, their significant index weight means their performance can heavily influence market direction. Yet, their stretched valuations amidst higher rates may lead us to reevaluate client portfolios - especially if the valuation gap with the rest of the market gets wider and wider. We continue to keep a close eye on this.
Navigating Higher Yields in Bonds
As we see bond interest rates hitting levels we haven't seen in a very long time, many of you are asking us how to take advantage of these rates and what to do about the recent drop in bond prices.
Let's break it down: Despite a bit of a rollercoaster in the markets lately, where we've seen some of the gains from earlier in the year disappear, there's a silver lining for bonds. While not fun, it has created the most bond-friendly conditions since the depths of the 2008 financial crisis. GW&K Investment Management pointed out that yields on certain bonds, like the 10-year AAA municipal bonds, are at their highest since 2008, which means they're offering more income than they have in years. In fact, October was a busy month for them as they locked in tax equivalent yields — the rate on Muni Bonds plus the tax savings — of over 7%.
Because of these yields, the bond world is getting more and more attention. Even Barron's, famously slow to the punch, has highlighted the growing enthusiasm for bonds. Its cover story champions a bullish stance on the bond market, urging investors to shift their focus from past setbacks to the current buying opportunities. Put another way, the article implores investors to "stop crying" about losses and start buying.
As we approach the year's final stretch, traditionally a favorable season for bond investments, it may be time to reevaluate the outlook for bonds. The combination of high yields, geopolitical uncertainties, and the potential shift in monetary policy puts bonds into an attractive space as investors seek safety and reliable income. It is an opportune time for investors seeking refuge amid recessionary fears to consider the security and attractive yields bonds are offereing. Bank of America's Michael Hartnett recently made this argument, as he wrote in a recent note that “bonds should be the best-performing asset class in the first half of 2024."
Our proactive management team has been key in these turbulent times, enabling us to nab high yields within client portfolios. As always, we monitor the market closely and stand ready to make the necessary adjustments to our fixed-income approach, ensuring we are well-positioned to capture the benefits of the evolving bond market.
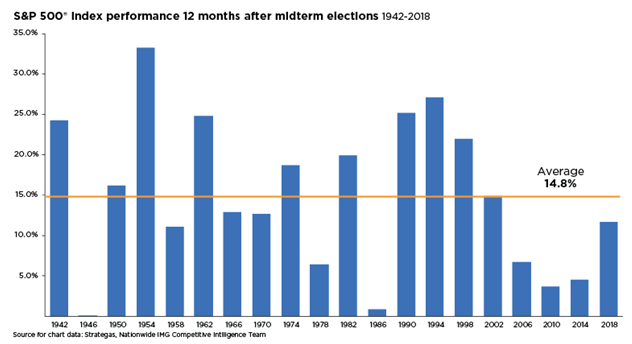
Chart of the Month – In the vein of revisiting Mr. Market, let's review the average return of the S&P 500 twelve months after mid-term elections (14.8% per Strategas). The return from last year's
mid-terms – a near average return of 14.1%.
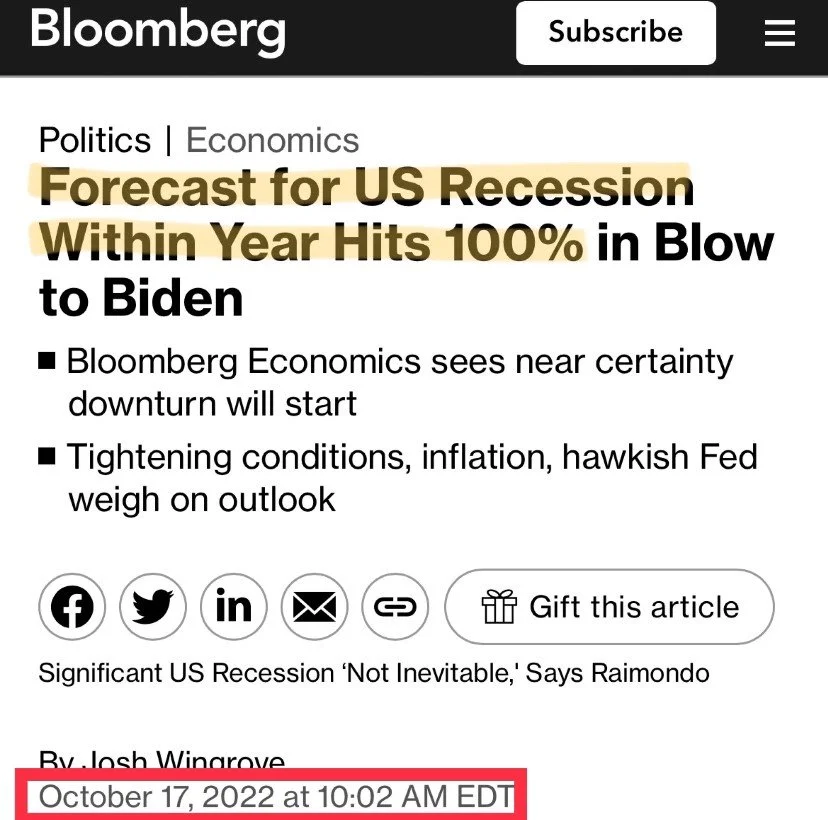
Picture of the Month – The one-year anniversary of this now “viral” headline. With due respect to Bloomberg, a reminder to treat any declaration of "100% certainty" with a strong dose of skepticism.
Allocation Update
At Highland Peak Wealth, our stance remains broadly consistent with our summer and early fall position – a touch on the defensive side, close to neutral. You've probably noticed that while the markets have had some winning moments this year, the road's been a bit bumpy with mixed messages about the economy. For all the doom and gloom, plenty of data out there paints a bullish picture. What's next? We're betting on a bit of a wait-and-see period, with the markets moving more or less sideways until the dust settles on interest rates and yields.
Our portfolios have benefited from holding a slightly larger cash reserve, which has been diligently earning a yield north of 5%. This tactical cash position has served us well over the last quarter. While we're not in a hurry to alter it, we're poised to deploy these funds should the market retreat significantly or compelling bond opportunities present themselves.
Speaking of bonds, we're proactively securing longer-term options, looking out over a decade, to grab attractive yields while they are here and hedge against potential rate decreases in 2024. Yet, we're cautious about significantly increasing our bond exposure until the Federal Reserve's rate hike trajectory becomes evident. Our focus remains on capturing value without compromising the calculated risk balance we've established for our portfolios.
Here’s a snapshot of our current outlook, in line with our tradition:
- Equities – Slightly Underweight (close to neutral)
o Growth continues to outperform Value
o We continue to prefer US stocks over international
o Artificial intelligence and those associated stocks have our attention (for now)
- Fixed Income – Slightly Underweight (more attention here)
o We continue to cautiously seek longer-term bonds to lock in higher yields while they are available
o We still like floating rate bonds – attractive yields and returns as rates continue to climb
o We are interested in adding more when it is clear the Fed is pausing on future rate hikes
- Alternatives – Neutral
o Private markets can add extra diversification through uncertain market periods
o In light of the terrible events overseas, gold performed well in October – up 6.8% for the month and up 7% YTD
- Cash – Overweight
o Money market funds and Treasury Bills continue to offer 5.3 – 5.5% yields
o This cash would ultimately be used to take advantage of market decline or opportunities in fixed income
October didn't provide us the stock market newsletter called for, but a mere 2% decline given all that transpired last month, in the famous words of Meat Loaf, ain't bad. As such, and as promised, I attached our family picture from this year's Halloween festivities to lift spirits. It's a tad embarrassing for Dad – that's how it goes!
Maintaining our beloved tradition, our pint-sized, in-house chief of creativity, five-year-old Teddy, masterminded this year's Halloween ensemble. Merging his passion for Legos and Ninjas, we (my wife) brought to life the characters from The LEGO NINJAGO Movie. Our household heroes, Teddy and Heather, faced off against the notorious Lord Garmadon (a Darth Vader lookalike) and his army of shark-themed henchmen (our one-year-old Cooper stole the show here). We had a ton of fun, and we're still riding the wave of that inevitable sugar rush.
From our family to yours, we wish you a warm and happy Thanksgiving. Remember this quote: "Vegetables are a must on a diet. I suggest carrot cake, zucchini bread, and pumpkin pie."
Jim Davis (Creator of Garfield)
As always, thank you for your support and readership.
Kyle M. McBurney, CFP®
Managing Partner
The opinions expressed herein are those of Kyle McBurney, CFP as of the date of writing and are subject to change. This commentary is brought to you courtesy of Highland Peak Wealth which offers securities and investment advisory services through registered representatives of MML Investors Services, LLC (Member FINRA, Member SIPC). Supervisory office: 280 Congress Street, Boston, MA 02210. (617)-439-4389. Highland Peak Wealth is not a subsidiary or affiliate of MML Investors Services, LLC or its affiliated companies. Past performance is not indicative of future performance. Information presented herein is meant for informational purposes only and should not be construed as specific tax, legal, or investment advice. Although the information has been gathered from sources believed to be reliable, it is not guaranteed. Please note that individual situations can vary, therefore, the information should only be relied upon when coordinated with individual professional advice. This material may contain forward looking statements that are subject to certain risks and uncertainties. Actual results, performance, or achievements may differ materially from those expressed or implied. This material does not constitute a recommendation to engage in or refrain from a particular course of action. Referenced indexes, such as the S&P 500, are unmanaged and their performance reflects the reinvestment of dividends and interest. Individuals cannot invest directly in an index. CRN202611-5346878
Glossary of Index Definitions
Indexes are unmanaged, do not incur fees or expenses, do not reflect any deduction for taxes, and cannot be purchased
directly by investors.
The S&P 500® Index is a widely recognized, unmanaged index representative of common stocks of larger capitalized U.S. companies.
The S&P Muni Bond Index is a broad, market value-weighted index that seeks to measure the performance of the U.S. Municipal bond market.
Dow Jones Industrial Average is a price-weighted average of 30 actively traded Blue Chip stocks, primarily industrials, but also including other service-oriented firms; may be used as a benchmark for large cap stocks
NASDAQ Composite is a broad-based index of over 3,000 companies, which measures all domestic, and non-U.S.-based common stocks listed on the NASDAQ Stock Market, Inc.
The NASDAQ 100 U.S. Index is a composed of the 100 largest, most actively traded U.S. companies listed on the Nasdaq stock exchange.
The Russell 2000® Index is a widely recognized, unmanaged index representative of common stocks of smaller capitalized U.S. companies.
The MSCI EAFE Index is a widely recognized, unmanaged index representative of equity securities in developed markets, excluding the U.S. and Canada.
The MSCI Emerging Markets (EM) Index is an unmanaged market capitalization-weighted index of equity securities of
companies domiciled in various countries. The Index is designed to represent the performance of emerging stock markets
throughout the world and excludes certain market segments unavailable to U.S.-based investors.
The MCSI All Country World Index (ACWI) captures large and mid cap representation across 23 Developed Markets and 24 Emerging Markets.
The Barclays U.S. Aggregate Bond Index is a broad measure of the U.S. investment-grade fixed-income securities market.
The Bloomberg U.S. Aggregate Bond Index is an unmanaged index of fixed-rate investment-grade securities with at least one year to maturity, combining the Bloomberg U.S. Treasury Bond Index, the Bloomberg U.S. Government-Related Bond Index, the Bloomberg U.S. Corporate Bond Index, and the Bloomberg U.S. Securitized Bond Index.
©2023 Morningstar, Inc. All Rights Reserved. The information contained herein: (1) is proprietary to Morningstar and/or its
content providers; (2) may not be copied or distributed; and (3) is not warranted to be accurate, complete or timely. Neither Morningstar nor its content providers are responsible for any damages or losses arising from any use of this information


