October 2023 - Keep Calm and Carry On
By: Kyle McBurney, CFP
Managing Partner at Highland Peak Wealth
Do you remember the film classic, Groundhog Day? Growing up, it was one of my absolute favorites.
Phil Connors, played by the legendary Bill Murray, was a cranky weatherman reliving February 2nd in gloomy Punxsutawney, PA. His job was to cover the somewhat dull annual festivities around the holiday and the locally famous groundhog, Punxsutawney Phil. As the movie continues, he is stuck in a never-ending loop, only to emerge after transforming his depressed, repetitive existence into a more fulfilling/positive journey.
Why do I bring this up?
In much the same way Groundhog Day portrays a continuous loop; September often feels like a recurring theme of market letdowns and frustration for investors. Going back to 1928, it is by far the worst calendar year for stocks - a pattern well-known to market enthusiasts. This year proved no different, with the S&P 500 retreating by nearly 5% and bonds following suit.
Now, there isn't an apparent reason why September markets are so dismal. It could be a lack of earnings, seasonal trading tendencies (cashing in on year's gains), or perhaps market-wide Phil Connors-like grumpiness from summer's end. Regardless of the root cause, it is always helpful for investors to keep this in mind before letting September's decline neither skew nor dim the future investment outlook.
In fact, for discerning investors, historical trends hint at potential opportunities on the horizon. Despite its reputation marred by significant market downturns in 1929 and 1987, October has often been the turning point, acting as the proverbial "bear killer." Jeffrey Hirsch's Stock Trader's Almanac draws attention to this pattern – suggesting a coming together of a September slump with an ensuing year-end rally.
Want an example? Here are the last three September’s and following Q4 returns for stocks –
Source: Morningstar Direct
Diving deeper into historical data reveals recurring patterns. Ritesh Samadhiya, a strategist at Bank of America, highlights a fascinating trend: since 1950, there have been 15 occasions when the S&P 500 surged by over 15% up to July, only to experience an average decline of 8% in the subsequent months of August and September (sound familiar). Yet, silver linings persist. Typically, after such downturns, the broader market tends to rally, with an average uptick of 5% observed from October through December, according to the bank's analysis.
Bottom line – the market has a long history of losing steam in August and September (check) after a strong first half rally (and check) only to rally to close the year.
Of course, while market seasonality offers a guide, it's merely a reflection of historical averages. A subdued September isn't a cue to divest entirely or act impulsively, but rather a reminder to calm the nerves. Drawing a parallel to Phil Connors' world - think of it more as "climate" rather than day-to-day "weather".
We hope you enjoy this newsletter as we summarize what we saw in Q3, and highlight some allocation shifts as we approach the historically bullish 4th quarter.
Source: Morningstar Direct
Past Performance is No Guarantee of Future Results
What We Saw in Q3
All around, the third quarter wasn’t pretty for markets. Q3 saw sharp reversals in all three primary stock market indices –
S&P 500 down 3.7%
Dow Jones decreased 2.7%,
The Nasdaq dropped by 4.1%.
These declines represent the steepest since the same quarter of the previous year when markets verged on bear territory.
Looking deeper, those dominant tech stocks, previously coined the “Magnificent Seven,” stumbled somewhat. Cumulatively, these tech giants shed around $438 billion in market cap. Apple, the world’s most valuable firm, saw a notable 12% decline. A rarity for what has recently been a very steady stock.
On the flip side, the energy sector showcased its resilience. Fueled by surging crude prices (which we'll delve into further), the industry shined, appreciating 11% in the recent quarter.
However, it's essential to keep the broader picture in mind: despite the recent setbacks, all three indices remain in the positive for the year, with the widely-referenced S&P 500 still boasting double-digit growth.
Still, August and September were not fun for investors. What the heck happened?
In our view, three key factors that played a pivotal role in the September market downtrend.
1) Crude Oil’s Climb
Oil prices have gone up a lot recently. Right now, a barrel of oil costs about $90 - 30% higher than it was in June. Why? One big reason is that OPEC, a group of countries that produce a lot of the world's oil, decided to produce less earlier this summer, straining supply and pushing prices higher.
Higher oil prices can be good news if you own stocks in oil companies. Swift hikes in oil prices tend to throw cold water on business profits. It can also make the cost of living go up, making things harder for everyday people. Plus, the Federal Reserve aims to keep rising prices (inflation) at 2%, and high oil prices can make this goal harder to reach (read higher interest rates).
Also noteworthy, some banks have raised a caution flag. Analysts at J.P. Morgan, for example, fear if oil prices get too ambitious and touch the $120 mark, our global economy could hit a rough patch. We are still a ways away from that threshold, of course. Nonetheless, we are keeping an eye on oil prices daily.
2) Bond Yields Surge to 15 Year High
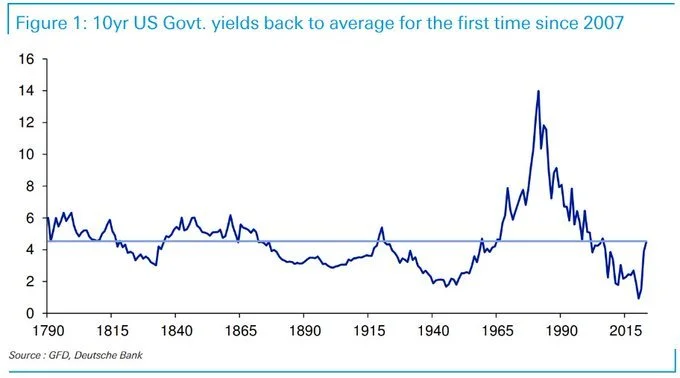
In a noteworthy financial development, the 10-year Treasury yields have ascended to heights unseen since 2007, eclipsing the 4.6% threshold. Below is very interesting chart from Deutsche Bank illustrating historical yields on the 10-year Treasury Bond. You can see how quickly yields have jumped over the past year, which has continued so far into 2023.
**As an aside, and as a history buff, I find this chart interesting as it encapsulates the entire lifespan of the United States – it really puts the 70s and 80s into perspective, as well as how low interest rates have been since the financial crisis. Fascinating!
The recent surge in yields has cast a shadow over stocks. While elevated bond yields benefit income-seeking investors, they dampen the fervor of the stock market. These yields, in essence, act as a barometer: a significant rise typically indicates market anticipation of sustained high rates, a prospect that stock enthusiasts find unsettling.
Furthermore, as yields climb, they may shift investments from volatile stocks to the more stable ground of treasury bonds.
3) Interest Rates and the Fed
Interest rates continued their climb through the summer months, making it harder to borrow and lend across the economy. Signs that the economy isn’t slowing have pushed up yields across the board. Many hoped 2023 would bring a more lenient Federal Reserve and end the escalating rates. Yet, the waiting game continues for investors.
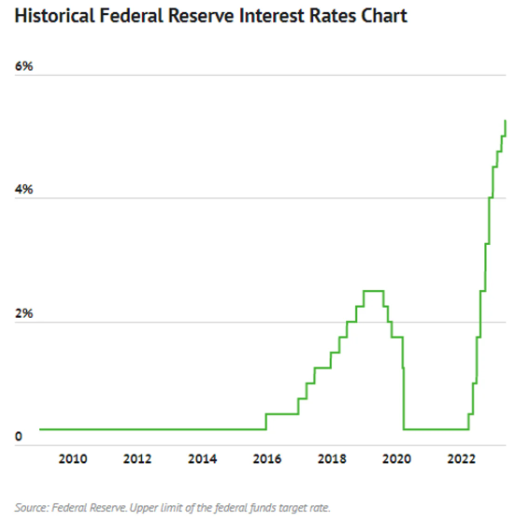
In their latest pow-wow, the Federal Reserve decided to pump the brakes and keep interest rates steady at a 22-year high. Despite the pause, it has become evident to markets that higher rates will be here longer than anticipated. The below chart highlights how far rates have moved higher in such a short period:
This move by the Federal Reserve brought a brief sigh of relief to stock markets, but it wasn't a game-changer. The million-dollar question on everyone's mind: will there be another rate hike this year? Fed Chair Jerome Powell kept his cards close to his chest. However, the whispers in financial circles suggest that another rate hike might be on the horizon to keep inflation in check - a sentiment recently echoed by Cleveland Fed President Loretta Mester.
Of course, if inflation eases its grip and the Fed eases, the stock market may find steadier ground. But given the roller-coaster nature of recent economic events, we continue to pay close attention to rate expectations and hints from the Fed. A "higher for longer" rate scenario isn't ideal for stocks but does make things more attractive to those looking for income.
Looking Ahead – Cash & Bonds
With rising rates and Treasury Bonds offering appealing yields, many clients have been echoing a similar question: Why not position all our fixed income in cash?
After more negative returns as rates have risen, we certainly understand the question. After all, below are this week’s short-term treasury bond yields. Tempting, no?
Tenor Yield
3 Month 5.435%
6 Month 5.533%
12 Month 5.469%
We understand the appeal of cash all too well. Our team has been harnessing higher yields for our clients for over a year. A market offering a 5% return with limited risk is undeniably enticing. It provides investors with short-term liquidity requirements and a dependable avenue for returns, something absent for the past 15 years. Furthermore, these appealing yields stand out even more in the current bond market, which has seen a downturn for the year, as evidenced by the negative returns in the Barclays Aggregate Bond Index and the S&P Muni Bond Index. Ouch!
Going forward, the bond market, especially the Muni bond market, is in much better shape with higher yields and a less inverted yield curve. Yes, negative returns are unsettling, but the patient investor can lock in some fantastic yields. In the words of John Ferguson at GW&K, "The reinvestment opportunities are simply too good to not be excited."
The metrics speak for themselves: GW&K's Muni composite yield settled at 3.80% by the month's conclusion. This equates to a tax-equivalent yield (TEY) of an impressive 6.42% before considering the added value of active management. For clients in high-tax states, the TEY rates are particularly favorable. For instance, a recent purchase of a 15-year California bond offered a yield of 4.09%. For those in California's top tax bracket, this corresponds to a TEY of nearly 8.91%.
To bond investors feeling the pinch– stay the course. As rates stabilize, now's an opportune moment to secure these yields.
Will Q4 Bring Relief to Stocks?
As we bid goodbye to the third quarter, we're stepping into the fourth quarter — historically a bright spot for stocks. According to data from the Carson Group, the S&P 500, since 1950, has enjoyed an average gain of 4.2% in this period, making it the star performer when compared to other quarters.
So, what makes the fourth quarter shine? While there's no one-size-fits-all answer, a mix of factors play their part. These include updated annual forecasts from companies, tweaks made to portfolios as the year draws to a close, the general cheer of the holiday season, and a rebound from September's usual dips. Below, you'll find a chart painting a clear picture of the S&P 500's journey through the year, with the uptrend in November and December standing out.
Source: Ritholtz Wealth Management
It's crucial to remember, though, that while this analysis offers a snapshot of the past, it's just a guide, not a guarantee. The investment landscape is peppered with rosy and gloomy headlines, but isn't it always? There's no small list of concerns, whether it's an inverted yield curve or rising interest rates. However, on the sunnier side, we've got the ISM Manufacturing hitting its highest since September 2022, personal incomes peaking at a five-month high, and inflation, as per the core PCE, at its gentlest since November 2020.
The positive seasonal setup is no reason to go overboard with stock exposure. Still, it is a reminder to stay invested – an additional nudge reminding us of the virtues of staying invested and keeping a balanced view.
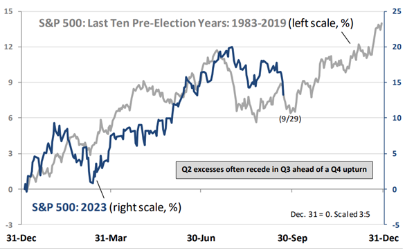
Chart of the Month – Yet another seasonal reminder. This one is even more specific, highlighting the typical pre-election-year market path. Interestingly, the summer months are even more painful than usual, only to finish the year with momentum. As investors, let's hope for the same.
Source: Oppenheimer
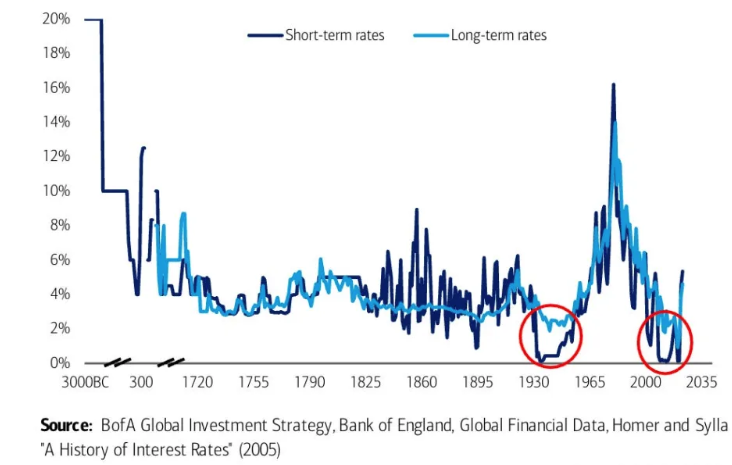
An October Bonus – Here is a fun one from Bank of America Global Investment Strategy. Unsurprisingly, this chart has gone somewhat “viral” given its incredibly long data set. I am unsure how they put this all together, but I thought it was worth a share. It is at least reassuring to know we still have lower interest rates than Julius Caesar!
Allocation Update
Mr. Market continues to send investors mixed signals and keep us on our toes. At Highland Peak Wealth, our stance remains broadly consistent with our summer position – a touch on the defensive side, yet cautiously close to neutral. This year's impressive gains have come against a handful of mixed economic indicators. Depending on your narrative, we might be at the dawn of a new bull market or on the edge of a sharp downturn. Our perspective? We prefer to take a more moderate approach and keep the long-term view in mind.
Our hands haven't been idle, though. Continuously fine‐tuning portfolios and assessing performance are the order of the day. We're leaning towards stashing a bit more in cash yielding 5%, favoring the U.S. over international equities, leaning towards larger stocks, and finding growing appeal in growth stocks and A.I.‐focused tech amid economic decelerations. We beleive that balance is important at this time, especially with so much noise from the headlines.
Here’s a snapshot of our current outlook, in line with our tradition:
Equities – Slightly Underweight (close to neutral)
o Growth continues to beat Value as we go deeper into ’23. Even in a difficult Q3, growth stocks outperformed value by ~1.5%
o We continue to like US stocks over international. We are less interested in the International Developed and Emerging categories
o Artificial intelligence and those associated stocks have our attention (for now)
- Fixed Income – Slightly Underweight
o We continue to cautiously seek longer-term bonds to lock in higher yields while they are available
o We still like floating rate bonds – attractive yields and returns as rates continue to climb
- Alternatives – Neutral
o Private markets can add extra diversification through uncertain market periods
o Gold has been stuck in the mud recently and has done little to improve return – up just 1% in ‘23
- Cash – Overweight (recently increased)
o Money market funds and Treasury Bills continue to offer 5.3 – 5.5% yields
o Timing the market is hard, but cash offers dry powder in the event of a decline
Otherwise, our team at Highland Peak Wealth has also begun to turn our attention to end-of-year “to-do’s.” This is a good time of year to organize end-of-year gifting, donations, donor advised funds (DAFs), tax planning, and to satisfy those pesky required minimum distributions. Please do not hesitate to reach out.
Even though Phil Connors might've been wary of repetition, we, as young parents, thrive on it. With summer fading and school doors swinging open again, we're more than ready to embrace the rhythm of structured days. And now that September is behind us, the McBurney household is gearing up for a highlight of the year — Halloween! Our bushes are draped with spider webs, our lawn boasts a spooky graveyard, and ghosts seem to be dancing around our trees. Yes, we are those neighbors.
As predicted, our five-year-old, Teddy, is determined to dress as his favorite Lego characters. He is adamant that I join him, which I am happy to do. Up until recently, the alternative was that I dress up as Annie, the eight-year-old hero from his favorite book series, Magic Treehouse. For obvious reasons, dressing up as an evil Lego ninja is a welcome alternative. Either way, I have no doubt that I will embarrass myself, as every young parent does. If markets rebound in October, perhaps I will even be in enough good spirit to share a picture.
We hope that you have had an excellent start to fall. As always, we thank you for your support, trust, and readership.
Kyle M. McBurney, CFP®
Managing Partner
The opinions expressed herein are those of Kyle McBurney, CFP as of the date of writing and are subject to change. This commentary is brought to you courtesy of Highland Peak Wealth which offers securities and investment advisory services through registered representatives of MML Investors Services, LLC (Member FINRA, Member SIPC). Past performance is not indicative of future performance. Information presented herein is meant for informational purposes only and should not be construed as specific tax, legal, or investment advice. Although the information has been gathered from sources believed to be reliable, it is not guaranteed. Please note that individual situations can vary, therefore, the information should only be relied upon when coordinated with individual professional advice. This material may contain forward looking statements that are subject to certain risks and uncertainties. Actual results, performance, or achievements may differ materially from those expressed or implied. Referenced indexes, such as the S&P 500, are unmanaged and their performance reflects the reinvestment of dividends and interest. Individuals cannot invest directly in an index.
Glossary of Index Definitions
Indexes are unmanaged, do not incur fees or expenses, do not reflect any deduction for taxes, and cannot be purchased
directly by investors.
The S&P 500® Index is a widely recognized, unmanaged index representative of common stocks of larger capitalized U.S. companies.
The S&P Muni Bond Index is a broad, market value-weighted index that seeks to measure the performance of the U.S. Municipal bond market.
Dow Jones Industrial Average is a price-weighted average of 30 actively traded Blue Chip stocks, primarily industrials, but also including other service-oriented firms; may be used as a benchmark for large cap stocks
NASDAQ Composite is a broad-based index of over 3,000 companies, which measures all domestic, and non-U.S.-based common stocks listed on the NASDAQ Stock Market, Inc.
The NASDAQ 100 U.S. Index is a composed of the 100 largest, most actively traded U.S. companies listed on the Nasdaq stock exchange.
The Russell 2000® Index is a widely recognized, unmanaged index representative of common stocks of smaller capitalized U.S. companies.
The MSCI EAFE Index is a widely recognized, unmanaged index representative of equity securities in developed markets, excluding the U.S. and Canada.
The MSCI Emerging Markets (EM) Index is an unmanaged market capitalization-weighted index of equity securities of
companies domiciled in various countries. The Index is designed to represent the performance of emerging stock markets
throughout the world and excludes certain market segments unavailable to U.S.-based investors.
The MCSI All Country World Index (ACWI) captures large and mid cap representation across 23 Developed Markets and 24 Emerging Markets.
The Barclays U.S. Aggregate Bond Index is a broad measure of the U.S. investment-grade fixed-income securities market.
The Bloomberg U.S. Aggregate Bond Index is an unmanaged index of fixed-rate investment-grade securities with at least one year to maturity, combining the Bloomberg U.S. Treasury Bond Index, the Bloomberg U.S. Government-Related Bond Index, the Bloomberg U.S. Corporate Bond Index, and the Bloomberg U.S. Securitized Bond Index.
©2023 Morningstar, Inc. All Rights Reserved. The information contained herein: (1) is proprietary to Morningstar and/or its
content providers; (2) may not be copied or distributed; and (3) is not warranted to be accurate, complete or timely. Neither Morningstar nor its content providers are responsible for any damages or losses arising from any use of this information


