March 2024 - Unpacking February’s Fiesta
By: Kyle M. McBurney, CFP
Managing Partner at Highland Peak Wealth

Software is eating the world, but AI is going to eat software.
Jensen Huang, CEO of Nvidia
Let the good times roll.
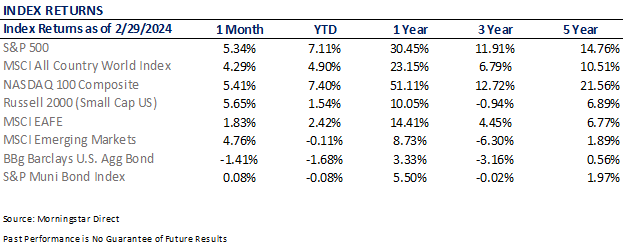
Despite this author's expectation of a market pause, markets continued to rally in February. The S&P 500 gained 5.34%, bringing its year-to-date return to an impressive 7.11%. U.S. Small-Cap stocks slightly outperformed U.S. large-cap stocks, while international equity markets also showed strong performance, with Emerging Markets leading the charge. For all of February's historical weakness, we didn't see any here.
Digging deeper, the resilience of the U.S. economy continues to stand out. The latest quarterly earnings have met and exceeded expectations, illustrating corporate America's finesse in steering through rising costs and the steepest interest rates in over two decades. Meanwhile, the job market's fervor, rising consumer optimism, and robust household financials provide a picture of economic strength and stability.
Of course, this wasn't last month's big headline. Markets are partying like it's 2021.
Although NFTs and SPACs remain on the sidelines (where they belong), markets have renewed energy and excitement. U.S. stocks and Bitcoin are both hitting new heights. And check out the Nasdaq – soaring 54% since last year kicked off according to Morningstar Direct, while the S&P 500 isn't too far behind with a 32% jump. And Nvidia? More on this later, but it is one of the most incredible runs that our industry has seen. After last month's earnings call, Nvidia rose by $276 billion in market cap in a single day – equivalent to the entire value of Chevron. Yes, that Chevron.
We can all agree this isn't typical market behavior.
Amidst this financial fiesta, whispers of the dreaded "B" word—bubbles—are making the rounds. A Bubble is a fun word for my two-year-old, but it is a spine-chilling one for investors. Historically, a market bubble is characterized by rapid escalation in asset prices followed by a sudden and inevitable collapse.
Yet, when we peek behind the curtain, the usual suspects that crash the bubble party seem to be MIA. The financial landscape shows no excessive leverage or speculative cash influx typically associated with bubbles. Although stocks may appear overvalued by some measures, the overall market dynamics indicate a more nuanced scenario. The Nasdaq's recovery above its pre-2021 levels, supported by corporate earnings, suggests a rational adjustment rather than wild speculation. The current valuation of the Nasdaq at 27 times forecasted earnings, though high, remains below the peak ratios observed during genuine bubble periods, including the one in the early 2000s.
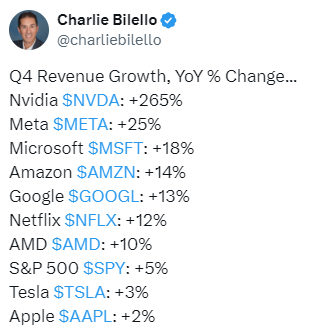
In Nvidia's case, the company's remarkable performance is supported by substantial profit growth and increased demand in the AI sector rather than mere speculative trading. The company’s Q4 year-over-year revenue growth was a ho hum 265%, as reported by Bloomberg. To summon my inner Boston philosopher, that's wicked good. This level of earnings growth indicates a market responding to real economic drivers rather than speculative enthusiasm.
In conclusion, while market caution is always wise, the current economic indicators, investor behavior, and valuation metrics do not unanimously imply the presence of a market bubble. That being said, we are continuously on the lookout. Our approach remains grounded in a complete analysis of market fundamentals and trends, ensuring that our investment strategies align with long-term objectives and risk tolerance.
Summary of Markets in February
February was a good month for stock markets – both domestically and abroad. The S&P 500 not only reached but soared to a new all-time high, climbing by +5.3% during the month and boosting its year-to-date return for 2024 to +7.1%. This surge can be attributed to several key factors: the ongoing disinflation, healthy economic and labor market data, the anticipation of rate cuts by the Federal Reserve (eventually), and corporate earnings that exceeded expectations benefitted from the increasing influence of artificial intelligence on profitability and productivity.
Market performance varied across categories, with Mid- and Small-Caps outperforming large-caps, a reversal from January’s returns. Growth stocks continue to surpass Value stocks, a trend that has persisted. Also noteworthy is that all eleven market sectors enjoyed positive returns, led by Consumer Discretionary and Industrials. Traditionally defensive sectors, such as Consumer Staples and Utilities, lagged.
On the other hand, the bond market has struggled, remaining in negative territory for the year as expectations for interest rate cuts have been delayed further into 2024.
Add it all up, and a diversified portfolio had a strong month and is off to an excellent start to 2024.
As we think about the core of this newsletter, three specific topics come to our mind:
A deeper look at corporate earnings
A strong economy and bonds
Our growing interest in Japanese stocks
Of course, a handful of other areas are on our radar, but these three topics have the bulk of our attention. Please do not hesitate to reach out to discuss subjects not addressed in this newsletter.
Impressive Earnings in Tech
Against economic uncertainty, the S&P 500 has not only reached but soared to unprecedented heights – past 5,000 - buoyed by the much-improved U.S. economic landscape. February's rally, far from being a senseless rush higher, is anchored by surprisingly strong corporate earnings, with Q4 being the second successive quarter of year-over-year earnings growth. Of course, no sector was more impressive than those mega-cap stocks that soared in '23.
The "Magnificent Seven" - a constellation of mega-cap tech titans -- Nvidia, Microsoft, Amazon, Meta Platforms, Apple, Alphabet, and Tesla -- continues to shine as we dive deeper into 2024. The sector's earnings narrative is compelling, highlighted by Nvidia's astonishing 265% revenue growth in Q4 as monumental strides appear to be taking place in Artificial Intelligence (AI). Such growth isn't isolated; the entire "Magnificent Seven" cohort of tech giants continues to deliver eye-popping earnings outcomes.
If there is one thing our team at Highland Peak Wealth can point to and say,"—Aha! There's no bubble here!"—this would be it. Unlike the early 2000s tech bubble, which burst in the absence of earnings and common sense, today's market leaders are generating eye-popping profits.
This is not a call to mindlessly jump into these stocks. Valuations remain steep. Instead, the data points to a justification for the "Magnificent Seven's" 2023 rally that continues to date into 2024.
Of course, it wasn't all about tech stocks. Overall, earnings have been solid across the S&P 500. According to FactSet, earnings for companies in the S&P 500 rose by 4% in the fourth quarter compared to the same period a year ago, marking the second consecutive quarter of earnings growth for the index.
Also noteworthy, consumer-centric sectors continue to shine outside technology stocks, notably retail stocks, homebuilders, and construction companies, all up north of 8% per Morningstar. These are not the type of stocks that typically outperform in recessionary environments.
February’s market activity was bullish overall— a reminder of the much-improved economic outlook.
The Economy and Interest Rates
As is sometimes the case, good economic news isn’t always positive for fixed income returns.
As improving (and inflationary) economic data points come in, bonds have suffered, given the decreased likelihood of upcoming rate cuts in March and May. In fact, some economists now believe that there will be a zero-rate cut this year, acknowledging persistent inflation and robust economic data.
We wouldn’t go that far, but it is certainly interesting to hear the argument. It may get louder later in the year.
As mentioned in last month’s newsletter, rate expectations have shifted quickly. Below is a fascinating look from the Atlanta Federal Reserve -
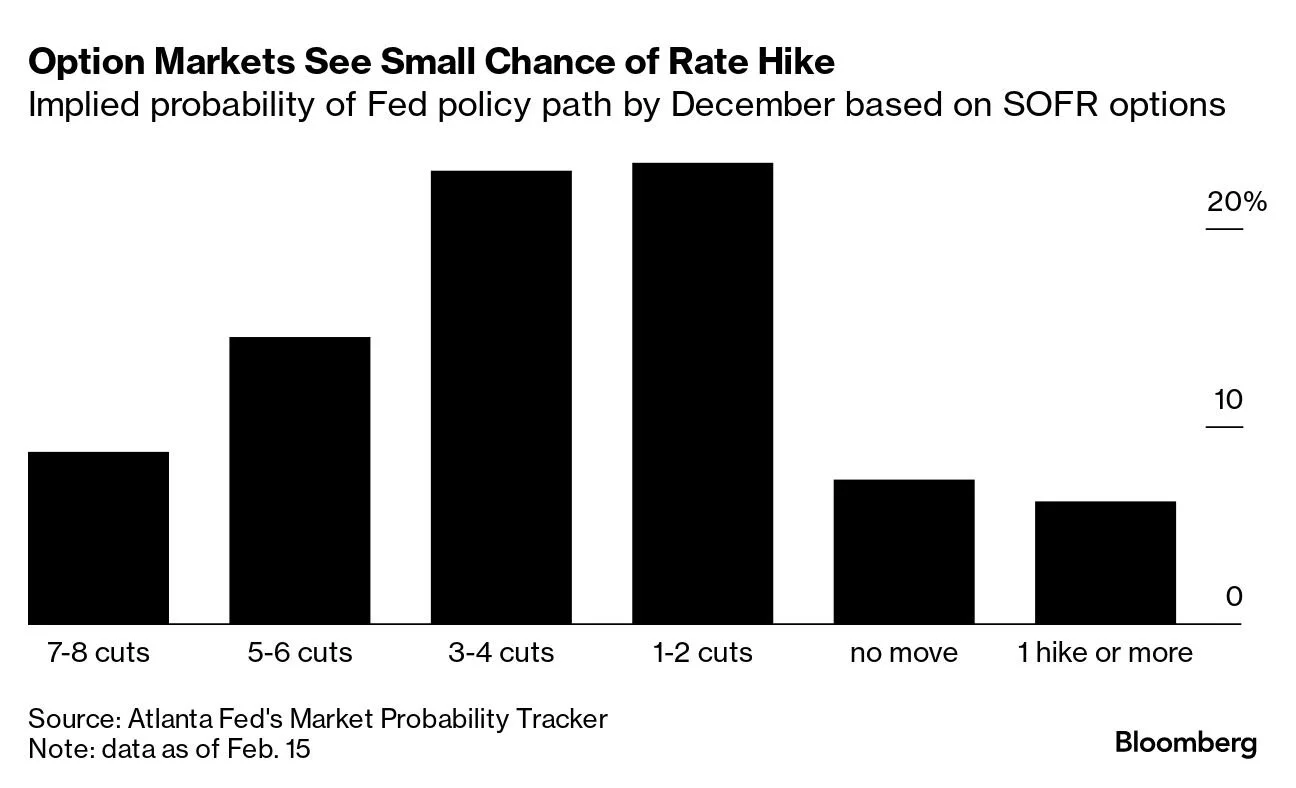
Currently, markets see 1-4 rate cuts as the most likely outcome for ’24, which would be a far cry from the market’s expectation of six or seven rate cuts to start the year.
The Federal Reserve echoes this market sentiment. Fed Chair Jerome Powell and other officials have indicated a cautious stance on rate cuts, emphasizing the need for confidence in inflation normalization before considering such actions. After all, inflation continues to impact Americans, particularly in essential areas like rent, groceries, and gas. Food prices saw a notable rise from December to January, marking the highest monthly rate increase in a year.
So, what does this mean to your portfolio? A few thoughts –
Attractive yields and cash alternatives are sticking around for longer than anticipated.
Shorter maturity bonds have so far outperformed long-term bonds.
Still, it is a fantastic environment to lock in attractive yields before rate cuts eventually occur.
This backdrop of a strong economy yet cautious interest rate outlook underscores investors' need to remain nimble in fixed income. As we seek more clarity around interest rates, our focus shifts towards identifying sectors and investments that can navigate or even thrive amidst steady or slightly elevated interest rates—such as CLOs and floating-rate fixed income.
Emergence of Japanese Stocks
As we look across international markets across the developed world, Japan's markets stand out.
Already up 19.8% for the year, per Bloomberg and the IMF, the Nikkei 225 Index (Japan’s S&P 500 equivalent) has some real momentum behind it. After all, it only took 36 years to get back to its previous all-time high. To provide some perspective, the last time Japanese equities were this high, the movie Die Hard (the first one) had just been released.
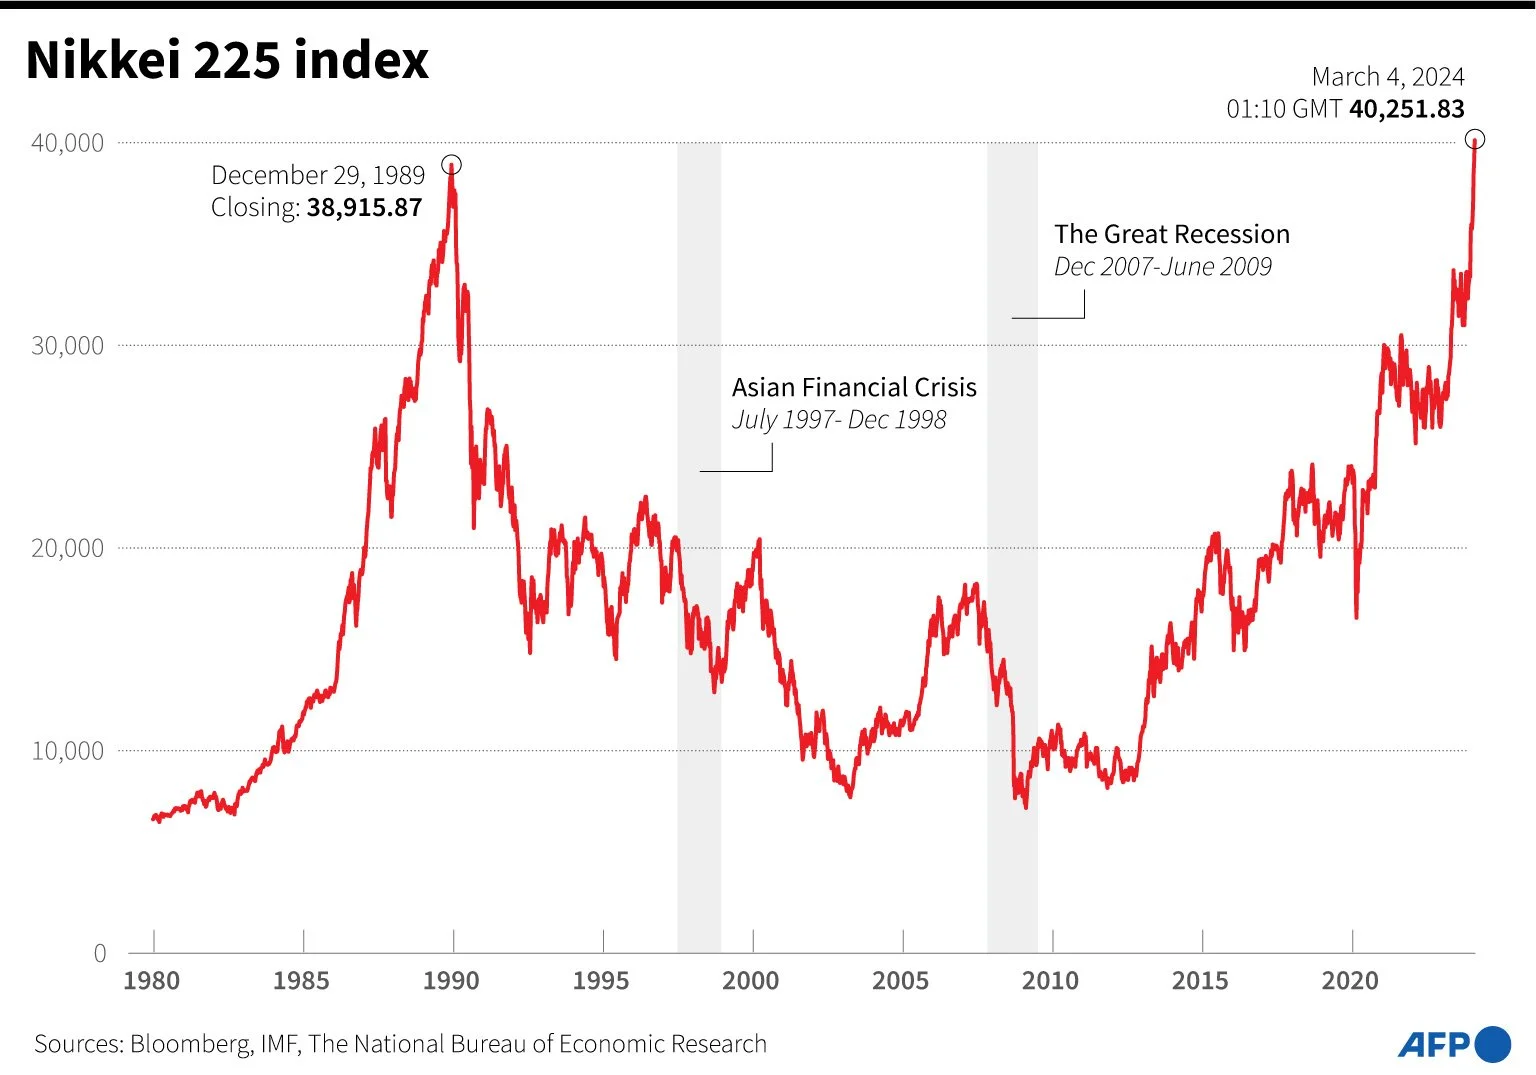
The Japanese stock market continues to set new records, with analysts increasing their forecasts amid surges in semiconductor stocks and positive earnings trends. These trends are driven by fundamental, long-term factors such as corporate governance reforms and a shift toward inflation.
In addition, there is a growing "fear of missing out" (FOMO) among global investors regarding Japanese equities, as many are currently underweight in their portfolios, missing the robust performance exemplified by the Nikkei Stock Average's 19.8% increase year-to-date and its recent surpassing of the 40,000 mark, per Bloomberg.
Our team at Highland Peak Wealth has been interested in Japanese equities for the past few months. This is not to say that we recommend the entire international allocation to be in Japanese stocks, but we believe that an overweight position may make sense for certain investors.
We are not alone, of course. Analysts, including those from Bank of America Securities and Citigroup, have raised their year-end expectations for the Nikkei and the Tokyo Stock Price Index, citing factors such as improved earnings estimates and favorable market conditions supported by Japan's monetary policy.
Chart of the Month – A review of today’s environment as compared to the post WWII economy.
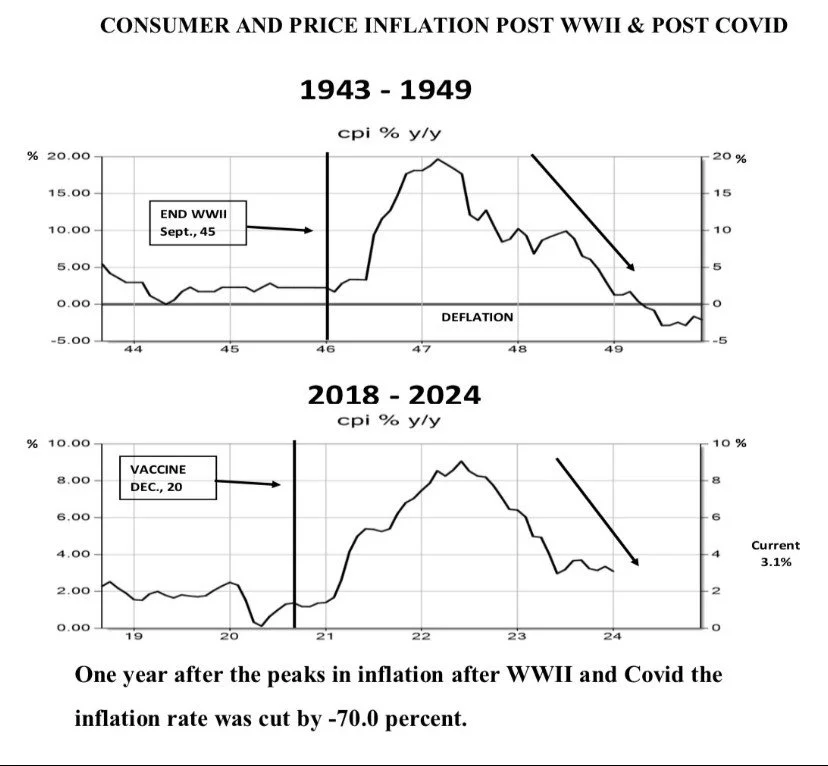
Source: Garzarelli Investment Newsletter
This newsletter has alluded to the post-World War II analogy in the past. To this author, the analogy makes sense. From a financial perspective, COVID and the financial response it elicited resembled previous war-time conditions. The more data that comes out, the more our current environment mimics the late ’40s and early ‘50s.
Elaine Garzarelli, who produced this chart and writes a fantastic newsletter, comments, “Money supply is a leading indicator of inflation and has fallen from 27.0 percent in 2021 to -2.0 percent (y/y). This suggests continued disinflation over the next six to twelve months and, we believe, the Fed’s 2.0 percent target will soon arrive.”
We certainly hope she is correct.
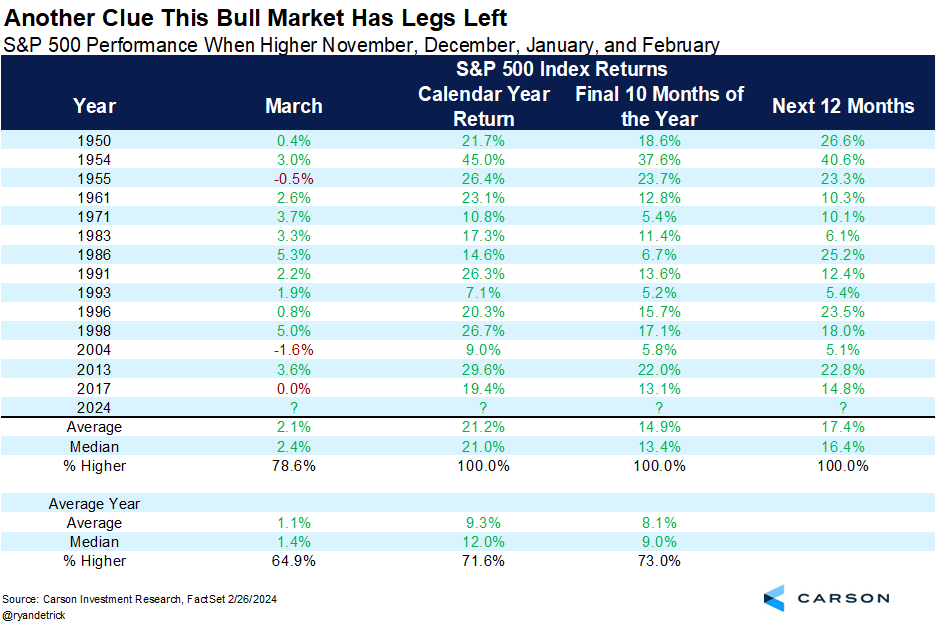
Chart of the Month Part 2 – In stocks, as we are seeing in Japan, momentum matters. Apologies for the small print (online version recommended).
Allocation Update
Our perspective has become more optimistic because of better-than-anticipated earnings and economic growth, along with a more favorable fiscal environment. Additionally, lower inflation and strong labor market conditions have encouraged risk-taking. Momentum matters in the world of stocks. As seen above, history points to a strong trend of higher markets when November, December, January, and February produce positive S&P 500 returns.
However, we think it's important not to become overly aggressive in taking risks at this time. While the current economic climate is favorable, it poses distinct challenges for the stock market. If the strength in the job market, consumer confidence, and household finances continues, the Federal Reserve may need to maintain higher interest rates for an extended period. This scenario could lead to an increasing number of publicly traded companies refinancing at significantly higher rates than before. As a result, the stock market might not fully capitalize on the economy's hardiness.
To use a sports analogy, we prefer to maintain a balanced mix between offense and defense. Until something changes, any pullbacks will likely be viewed opportunistically. We will communicate any changes as we get deeper into 2024.
Here’s a snapshot of our current outlook:
Equities – Balanced Approach:
U.S. Stocks Preferred: Our inclination continues towards U.S. equities over international markets.
Developed International: While the Eurozone remains underwhelming, we have become more focused and interested in Japanese equities.
Emerging Markets: We maintain a selective approach, with an increasing focus on Indian markets (so far, so good).
Sectoral Watch: Special attention is being given to the Artificial Intelligence sector, particularly in Technology and HealthTech, due to both sectors' innovation potential and growth opportunities.
Fixed Income – Slightly Underweight (with increased focus):
Long-Term Bonds: We continue to seek longer-term bonds to lock in the higher yields currently available.
Floating Rate Bonds and CLOs: Our outlook remains positive for these options, offering attractive yields and returns and hedging against higher rates.
Opportunistic Strategy: With lower returns from cash, we are exploring more strategic opportunities within fixed income.
Alternatives – Slightly Underweight
Private Markets: These offer additional diversification benefits during uncertain market conditions.
Gold Performance: As with stocks, Gold had a strong ’23 and is off to a strong start in ’24 (up 4% in ’24 per Koyfin).
Cash – Getting Closer to Neutral
Current Trends: The appeal of money market funds and Treasury Bills has diminished with falling rates.
Strategic Use of Cash: Our strategy involves using this excess cash to seize market opportunities in fixed income.
March brings spring training, warmer weather, and tax preparation—all of which are equally enjoyable. You should have all the necessary tax forms by now, but we are standing by to help if you do not. We are here to provide you and your tax advisors with all needed information.
The McBurney household continues to thrive in its unique brand of organized chaos. Visitors are often greeted by what seems like a pristine living space, but let's be honest—the floor is usually a tapestry of Legos, various toys, and an eclectic mix of Cooper's snacks. I've dubbed it the “mess hydra” : tackle one mess and, like magic, two more spring up in its place. The epicenter of this delightful chaos? That would be Cooper, our adventurous two-year-old.
Before Cooper's arrival, we were forewarned about the night-and-day difference between the first and second child. So true! If Teddy is the epitome of order and precision, Cooper is a hurricane. Teddy approaches life with caution and thoughtfulness. On the other hand, Cooper is more the leap-first look-later type, ready to dive off furniture without any backup plan. To put it another way, these two would have very different Investment Policy Statements!
As always, thank you for your support and readership.
Kyle M. McBurney, CFP®
Managing Partner
CRN202703-6077709
The opinions expressed herein are those of Kyle McBurney, CFP as of the date of writing and are subject to change. This commentary is brought to you courtesy of Highland Peak Wealth which offers securities and investment advisory services through registered representatives of MML Investors Services, LLC (Member FINRA, Member SIPC). Supervisory office: 280 Congress Street, Boston, MA 02210. (617)-439-4389. Highland Peak Wealth is not a subsidiary or affiliate of MML Investors Services, LLC or its affiliated companies. Past performance is not indicative of future performance. Information presented herein is meant for informational purposes only and should not be construed as specific tax, legal, or investment advice. Although the information has been gathered from sources believed to be reliable, it is not guaranteed. Please note that individual situations can vary, therefore, the information should only be relied upon when coordinated with individual professional advice. This material may contain forward looking statements that are subject to certain risks and uncertainties. Actual results, performance, or achievements may differ materially from those expressed or implied. This material does not constitute a recommendation to engage in or refrain from a particular course of action. Referenced indexes, such as the S&P 500, are unmanaged and their performance reflects the reinvestment of dividends and interest. Individuals cannot invest directly in an index.
Glossary of Index Definitions
Indexes are unmanaged, do not incur fees or expenses, do not reflect any deduction for taxes, and cannot be purchased
directly by investors.
The S&P 500® Index is a widely recognized, unmanaged index representative of common stocks of larger capitalized U.S. companies.
The S&P Muni Bond Index is a broad, market value-weighted index that seeks to measure the performance of the U.S. Municipal bond market.
Dow Jones Industrial Average is a price-weighted average of 30 actively traded Blue Chip stocks, primarily industrials, but also including other service-oriented firms; may be used as a benchmark for large cap stocks
NASDAQ Composite is a broad-based index of over 3,000 companies, which measures all domestic, and non-U.S.-based common stocks listed on the NASDAQ Stock Market, Inc.
The NASDAQ 100 U.S. Index is a composed of the 100 largest, most actively traded U.S. companies listed on the Nasdaq stock exchange.
The Russell 2000® Index is a widely recognized, unmanaged index representative of common stocks of smaller capitalized U.S. companies.
The MSCI EAFE Index is a widely recognized, unmanaged index representative of equity securities in developed markets, excluding the U.S. and Canada.
The MSCI Emerging Markets (EM) Index is an unmanaged market capitalization-weighted index of equity securities of
companies domiciled in various countries. The Index is designed to represent the performance of emerging stock markets
throughout the world and excludes certain market segments unavailable to U.S.-based investors.
The MCSI All Country World Index (ACWI) captures large and mid cap representation across 23 Developed Markets and 24 Emerging Markets.
The Barclays U.S. Aggregate Bond Index is a broad measure of the U.S. investment-grade fixed-income securities market.
The Bloomberg U.S. Aggregate Bond Index is an unmanaged index of fixed-rate investment-grade securities with at least one year to maturity, combining the Bloomberg U.S. Treasury Bond Index, the Bloomberg U.S. Government-Related Bond Index, the Bloomberg U.S. Corporate Bond Index, and the Bloomberg U.S. Securitized Bond Index.
The Nikkei Index is a price-weighted index composed of Japan’s top 225 blue-chip companies traded on the Tokyo Stock Exchange.
©2023 Morningstar, Inc. All Rights Reserved. The information contained herein: (1) is proprietary to Morningstar and/or its
content providers; (2) may not be copied or distributed; and (3) is not warranted to be accurate, complete or timely. Neither Morningstar nor its content providers are responsible for any damages or losses arising from any use of this information