June 2023 - Debt Ceiling Relief & The Magnificent Seven
By: Kyle McBurney, CFP
Managing Partner at Highland Peak Wealth
In the movie "Ghostbusters," the Ghostbusters are called to a hotel to handle a frightening paranormal incident. They draw out their proton packs and prepare for a big, prolonged fight. However, as they cautiously approach the source of the disturbance, they discover that it's not a ghost but rather a harmless maid pushing a cart with rattling dishes. Comical as always, one of the Ghostbusters, Dr. Peter Venkman (played by Bill Murray), holds up his hand and says, "We came, we saw, we kicked its ass!"
At the end of the day, worries surrounding the debt ceiling and government funding were overblown. After weeks of tense negotiations, the White House and Congressional leaders reached a bipartisan deal on May 27. The agreement raised the debt limit, prevented economic catastrophe, and included measures such as taking back unspent COVID funds, implementing spending caps, and reforming the energy permitting process. Surprisingly, the deal was reached with far less back-and-forth than many anticipated (including yours truly). Whether you like the deal or hate the deal, I promise you the alternative was far, far worse. This was a win for the markets.
Following the news, markets rallied, closing the month with relative stability, mirroring April's tight trading range. The S&P 500 recorded a modest 0.38% gain, while international stocks lagged. Stealing the spotlight was, however, the Nasdaq 100 Index, particularly buoyed by select tech stocks capitalizing on the burgeoning field of artificial intelligence. More on this later.
With the debt ceiling now in the rearview, what now?
Although I lack the longevity of so many of my esteemed partners and colleagues, I can’t recall a time when pundits and research firms were so polarized – a seemingly 50/50 split between those who believe a bull market is here and those who believe that severe pain lies ahead. Mr. Market lacks conviction. After all, there are many data points that investors can point to and say, “A ha! Here comes the market collapse.” In contrast, other data points fuel market bulls to passionately proclaim, “damn the torpedoes, full speed ahead!”
Since mid-October, during the lows of this bear market cycle, the S&P 500 has staged an impressive comeback. While we have yet to reach all-time highs, this rally stands out given the backdrop of inflation and recession concerns. Also, this rally doesn't resemble the beginnings of previous bull markets, and the underlying problems that initially led to market decline still need to be solved. Notably, small-cap stocks, typically leaders in the early stages of a bull market, have lagged, and by a wide margin.
As astutely suggested by Chris Verrone, a technical guru at Strategas, we find ourselves in a perplexing situation—this could either be the feeblest start to a new bull market or the longest bear market rally in history. Isn't investing easy? We are reminded once again to stay the course and maintain a diversified approach, regardless of how dire matters appear.
Ultimately, May's lack of convincing catalysts has not changed our previous outlook. While resolving the debt ceiling issue was positive, our concerns remain intact. Despite this year's rally, providing relief from last year's downturn, we remain cautious about upcoming challenges. Additionally, the market seems stuck in indecision, lacking clear direction. We are happy to stay balanced and diversified as we wait for Mr. Market to give us a little guidance.
The Magnificent Seven
In 1960, John Sturges directed the timeless classic western, "The Magnificent Seven." This film has stood the test of time and remains a beloved cinematic gem. In 2016, a remake was made, as is the case with many reboots. However, it fell short in capturing the magic that made the original so captivating.
The storyline revolves around seven gunslingers who bravely aid Mexican villagers in liberating their town from the clutches of ruthless thugs and bandits. Battling overwhelming odds, these seven individuals rely on their unmatched fighting skills and tactical genius to protect the defenseless village.
The movie poster above perfectly encapsulated the essence of the film with its compelling tagline - "They were seven... THEY FOUGHT LIKE SEVEN HUNDRED!"
Drawing a parallel to the present, the phenomenon unfolding in the stock market during 2023 resembles the determination displayed by the seven protagonists of the film. But instead of seven gunslingers, we witness seven mega-cap stocks emerging as the driving force behind market returns. To put it another way, seven stocks are fighting like (S&P) 500!
Apple, Amazon, Facebook, Google, Microsoft, Nvidia, and Tesla, collectively known as the "magnificent seven," have led the way. While part of their resurgence can be attributed to the recovery from the tech sector's downturn in 2022; their rise has been further propelled by the astounding progress made in Artificial Intelligence (AI) and its widespread application in our daily lives. It has indeed been remarkable. These seven stocks have a story that is impossible to ignore. Troy & I will be sharing our thoughts about AI in upcoming newsletters.
For now, our focus is more macro – what happens to the market when leadership and return attribution are so heavily concentrated? Below is a great chart from FactSet and Goldman Sachs that highlights the disparity in 2023's market returns:
Source: FactSet, Goldman Sachs Global Investment Research
As this chart indicates, if we remove these seven behemoths from the index, US stocks would be up a paltry, barely above break even level. Yawn. But it does serve as a reminder of how important it is to be diversified – missing out on these seven names would be very detrimental to this year’s return.
This occurrence has also given investors pause. Many clients and investors have expressed concerns about the potential adverse effects of a top-heavy market. After all, if this select group loses its momentum, where does market strength come from? Will this group drag down the rest of the market?
More importantly, is a top-heavy market a bad omen for future returns?
To put it simply – not at all.
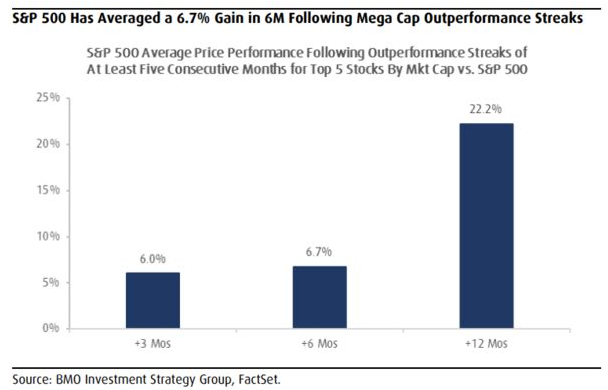
While a broad, widely distributed market rally is always preferable, a mega-cap-focused rally is more common than you might think and has historically led to above-average market returns. Research indicates that when the relative performance of mega-cap stocks subsides, or the winning streaks end, the broader market has traditionally held up well. In fact, market gains have been prevalent following previous outperformance streaks of five months or more in super-sized stocks.
The below chart from the BMO Investment Group is surprisingly bullish.
I admit, this one took me by surprise. During the subsequent six-month period after such mega cap streaks, the S&P 500 has risen by an average of 6.7%, with an average climb of 22.2% over the following 12 months. Remarkably, the S&P 500 has achieved positive price returns 100% of the time during these periods. A recent example occurred in April 2020, following a seven-month mega-cap winning streak. Six months later, the S&P 500 had advanced by over 12%, while the 12-month mark saw an impressive 43.6% gain.
So, as so often is the case, breathe. The 2023 scenario shouldn’t scare you. A concentrated market rally does not foretell doom and has a surprising habit of solid future returns. Of course, this alone isn’t enough for us to wholeheartedly jump back into the bull camp.
Inflation and interest rates – market drivers since the start of ’22 – remain front and center as we approach summer. We are happy to provide a brief update on both.
Inflation Continues to Cool
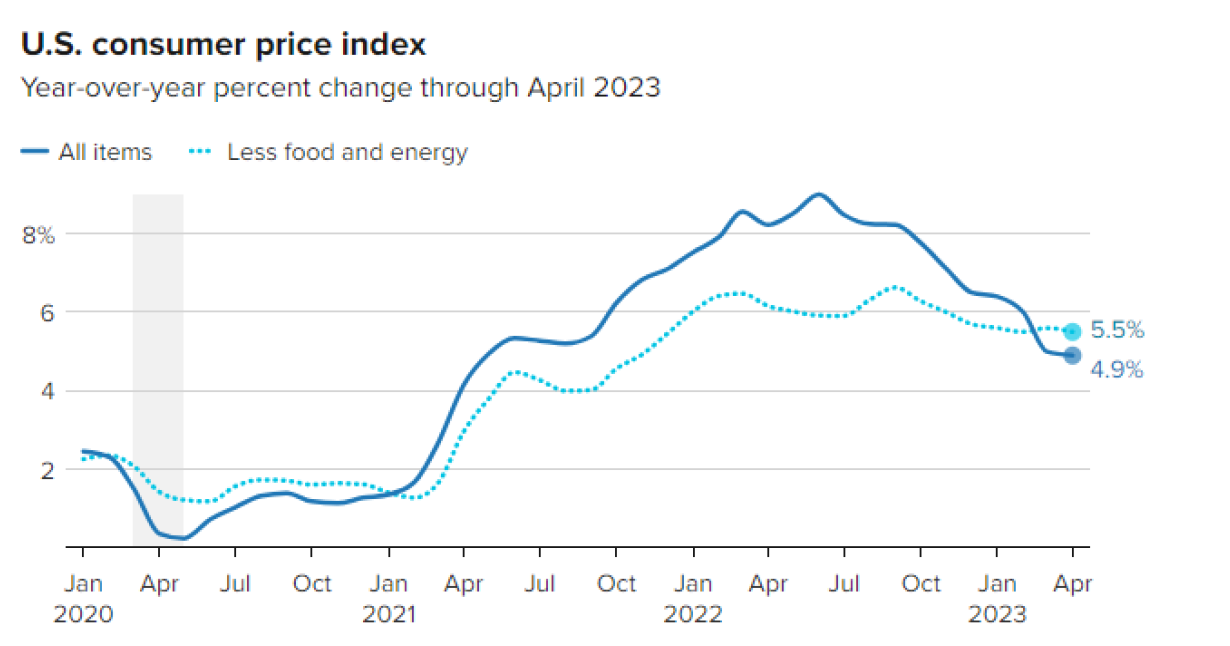
The good news keeps coming regarding the fight against inflation. We are not there yet, but inflation numbers reaffirm their downward trajectory towards more palatable levels as supply chains loosen and commodity prices return to earth.
Chart: Gabriel Cortes/CNBC
Source: U.S. Bureau of Labor Statistics
The latest tick from the Consumer Price Index (CPI) came in at 4.9% in April – well below the peak of 9.1% but still frustratingly above the Fed's long-term target of 2%. Also noteworthy, we observed an uptick in consumer prices, with a seasonally adjusted increase of 0.4%.
Looking under the hood, the report is even more interesting. Consumer prices experienced a seasonal uptick, with a 0.4% increase in April. This rise can be attributed to housing costs that continue to climb, along with slightly higher prices for gas and cars as we approach the summer season. However, economists anticipate a cooling down of the housing market in the coming months, which is good news for potential buyers looking for relief.
In light of the April CPI report, the Federal Reserve remains cautious. During a recent conference, Federal Reserve Chair Jerome Powell echoed concerns about the persistently high inflation levels. Powell and the entire central bank are committed to maintaining price stability. They are keenly aware of the dangers of a "stop and go" rate hike scenario, reminiscent of the turbulent 70s, and are determined to avoid it.
The fight against inflation is far from over, but the signs are encouraging. All attention is now on the Fed and its ultimate path.
Where We See Rates Moving
The Federal Reserve's May meeting had an intriguing twist. To no one's surprise, the central bank continued its rate hike streak, reaching an impressive ten consecutive increases since March 2022. However, it was the language and tone of the Fed that caught the attention of market observers. The central bank appeared to adopt a more flexible and adaptable approach, opting for a "meeting by meeting" strategy.
This change in stance generated a rally in the markets, as investors anticipated a more lenient Federal Reserve. Yet, uncertainty still prevails. Over the past couple of weeks, federal fund rate contracts have been fluctuating, initially pricing in a pause in rate hikes, only to switch to pricing in a rate hike following the stellar job report for May. Currently, markets assign a 42% rate hike probability in June.
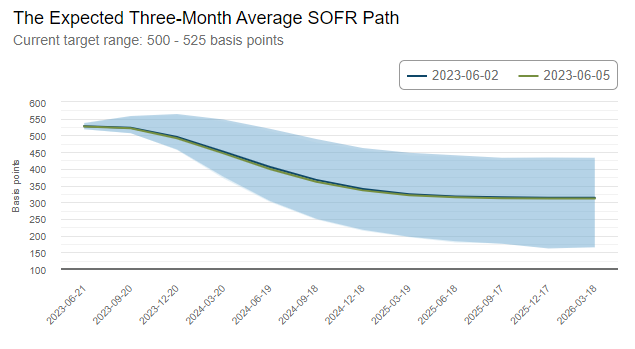
Regardless of the June outcome, the markets believe that rate hikes are coming to a conclusion. The Atlanta Fed's expected rate path, as illustrated below, indicates a clear expectation of declining rates as we move into 2024 and beyond.
Source: Atlantafed.org
So, what can we expect if this trajectory materializes, and the Fed does indeed pause and eventually cut rates?
Historical patterns indicate that the stock market tends to rally in such scenarios, with an average one-year gain of 17.5%. Bond yields also decrease, underscoring the importance of seizing attractive yields while they are available. Additionally, a potential increase in housing market activity could be on the horizon.
Of course, so much is apt to change, and a rate "pause" is not guaranteed. April's surprising upturn in the housing market and car prices serves as a reminder of the unpredictability of the situation. As always, we eagerly await updates and will provide you with the latest developments.
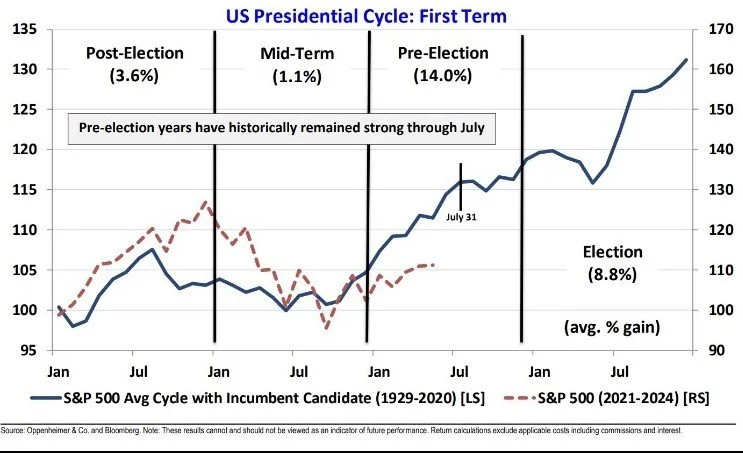
Bullish Chart of the Month – Summer has been historically strong for stocks in pre-election years.
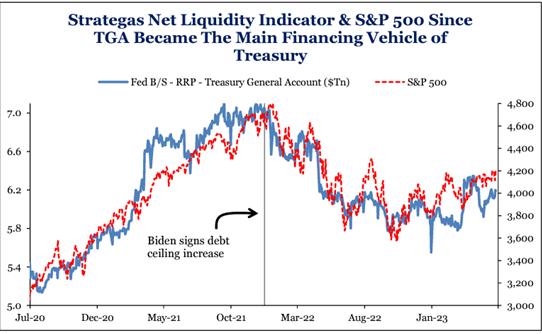
Bearish Chart of the Month – Stocks have been linked to liquidity since ’21 – for both good and bad. Expect austerity moving forward (not good).
Source: Strategas
Allocation Update
May failed to provide compelling reasons to alter our previous outlook. Although overcoming the debt ceiling issue was a welcomed development, our underlying concerns persist. While we appreciate the rally witnessed this year, which offered respite from the downturn of the previous year, we remain mindful of the obstacles that lie ahead. Moreover, the market appears to be caught in a state of indecision, lacking conviction in its movements. It's as if Mr. Market is unable to make up its mind.
While liquidity and a robust labor market have thus far upheld stock prices and ensured positive economic growth, we cannot overlook the troublesome trends in earnings and interest rates. Also, tighter financial conditions are putting pressure on corporate operations, and we anticipate that the full impact of monetary policy and inflation control (rate hikes) are yet to be fully realized, based on historical patterns.
In summary, we are sticking to our guns and maintaining a disciplined approach to portfolio positioning. While this may sound boring, we continue to preach the gospel of diversification as we await further direction from the ever-elusive Mr. Market.
- Equities – Slightly Underweight
o While growth outperformed value thus year in ‘23, we still like value long-term
o Artificial intelligence, and those associated stocks, have our attention (for now)
- Fixed Income – Slightly Underweight
o Continue to seek longer-term bonds to lock in higher yields while they are available
o We still like high yield, especially those companies that have strong fundamentals
- Alternatives – Neutral
o Private markets can add extra diversification through uncertain market periods
o Gold has performed well YTD – up 7.5% in ’23
- Cash – Overweight
o Money market funds and Treasury Bills continue to offer 4.5 – 5.25% yields
o Timing the market is hard, but cash offers dry powder in the event of a decline
Markets aside, Cooper's first birthday is fast approaching. Born last year on June 9th, it has been an incredible year, and he has been an absolute dream for his tired parents. To commemorate the special day, Teddy embarked on a mission to find the perfect birthday card for his little bro. After going to all the finest Walgreens and CVS establishments around, we nearly gave up. And then, it happened. Teddy stumbled upon a pink card, and there, right in the center, was a chicken – Teddy's favorite animal in the world. But not just any chicken, mind you. This chicken was wearing exercise gear, looking all confident and fabulous. But wait, it gets better. On the front of the card, in big, bold letters, it read, "To the Hottest Chick Around." Perfect. Well done, Teddy. Happy birthday, Cooper, you "hottest chick" you!
Cheers to all on a fantastic summer ahead. We all deserve it!
As always, comments and questions are welcome. Have a wonderful weekend ahead.
Kyle M. McBurney, CFP®
Managing Partner
The opinions expressed herein are those of Kyle McBurney, CFP as of the date of writing and are subject to change. This commentary is brought to you courtesy of Highland Peak Wealth which offers securities and investment advisory services through registered representatives of MML Investors Services, LLC (Member FINRA, Member SIPC). Past performance is not indicative of future performance. Information presented herein is meant for informational purposes only and should not be construed as specific tax, legal, or investment advice. Although the information has been gathered from sources believed to be reliable, it is not guaranteed. Please note that individual situations can vary, therefore, the information should only be relied upon when coordinated with individual professional advice. This material may contain forward looking statements that are subject to certain risks and uncertainties. Actual results, performance, or achievements may differ materially from those expressed or implied. Referenced indexes, such as the S&P 500, are unmanaged and their performance reflects the reinvestment of dividends and interest. Individuals cannot invest directly in an index. CRN202606-4528652
Asset allocation does not guarantee a profit or protect against loss in declining markets. There is no guarantee that a diversified portfolio will outperform a non-diversified portfolio or that diversification among asset classes will reduce risk.
Kyle McBurney is a registered representative of and offers securities and investment advisory services through MML Investors Services, LLC, Member SIPC. 101 Federal Street, Boston, MA 02110. (617)-439-4389. Highland Peak Wealth is not a subsidiary of affiliate of MML Investors Services, LLC or its affiliated companies.
Glossary of Index Definitions
Indexes are unmanaged, do not incur fees or expenses, do not reflect any deduction for taxes, and cannot be purchased
directly by investors.
The S&P 500® Index is a widely recognized, unmanaged index representative of common stocks of larger capitalized U.S. companies.
The S&P Muni Bond Index is a broad, market value-weighted index that seeks to measure the performance of the U.S. Municipal bond market.
Dow Jones Industrial Average is a price-weighted average of 30 actively traded Blue Chip stocks, primarily industrials, but also including other service-oriented firms; may be used as a benchmark for large cap stocks
NASDAQ Composite is a broad-based index of over 3,000 companies, which measures all domestic, and non-U.S.-based common stocks listed on the NASDAQ Stock Market, Inc.
The NASDAQ 100 U.S. Index is a composed of the 100 largest, most actively traded U.S. companies listed on the Nasdaq stock exchange.
The Russell 2000® Index is a widely recognized, unmanaged index representative of common stocks of smaller capitalized U.S. companies.
The MSCI EAFE Index is a widely recognized, unmanaged index representative of equity securities in developed markets, excluding the U.S. and Canada.
The MSCI Emerging Markets (EM) Index is an unmanaged market capitalization-weighted index of equity securities of
companies domiciled in various countries. The Index is designed to represent the performance of emerging stock markets
throughout the world and excludes certain market segments unavailable to U.S.-based investors.
The MCSI All Country World Index (ACWI) captures large and mid cap representation across 23 Developed Markets and 24 Emerging Markets.
The Barclays U.S. Aggregate Bond Index is a broad measure of the U.S. investment-grade fixed-income securities market.
The Bloomberg U.S. Aggregate Bond Index is an unmanaged index of fixed-rate investment-grade securities with at least one year to maturity, combining the Bloomberg U.S. Treasury Bond Index, the Bloomberg U.S. Government-Related Bond Index, the Bloomberg U.S. Corporate Bond Index, and the Bloomberg U.S. Securitized Bond Index.
©2023 Morningstar, Inc. All Rights Reserved. The information contained herein: (1) is proprietary to Morningstar and/or its
content providers; (2) may not be copied or distributed; and (3) is not warranted to be accurate, complete or timely. Neither Morningstar nor its content providers are responsible for any damages or losses arising from any use of this information


