MassMutual Market Update - 9.27.22
Daken J. Vanderburg, CFA
Head of Investments, Wealth Management
MML Investor Services
A father went to his son one day and handed him a watch. The watch was an old family heirloom with a cracked leather band and prominent scratch across the face. As the son studied the watch, the man asked his son to take it to the local merchant and find out the value. The son did as he was asked and soon returned with a watch and an estimate of $80. The man then asked his son to take the watch to the local jeweler and ask the same question. The son, growing somewhat impatient with this unimpressive heirloom, did as he was asked again, and soon returned with the watch and an estimate of $110.
The father pondered this for a moment and asked his son for one last trip. He asked his son to go visit a friend at the local museum, and again, to inquire as to the watch’s value.
Several hours later the son returned. He sat silently before his father with a stunned look on his face. After several moments, the father asked his son what his friend at the museum had said. The son quietly responded that the man at the museum had first put on white gloves, delicately and painstakingly evaluated the watch, then offered to buy the watch on the spot for $325,000.
The son was confused. He asked his father if he had known the watch’s true value? The father responded, yes, he knew its value, and that all three estimates were wrong, and all were undervaluing the watch. The father was given the watch by his father, and it was his sole tangible possession reminding him of his father. He valued the timekeeper more than any other possession he owned and explained to the son that he had no interest in ever selling the watch, but would instead one day give the watch to him.
While I find this allegory touching and prescient for several reasons, I see the most significant lesson being perspective. The watch held different value to each individual in the story based on their experience, their needs and, ultimately, their perspective.
As we explore and evaluate markets and opportunities right now, I find myself using the lens of perspective as a helpful mechanism for clarifying what we are going through, and what we, as investors, should be considering as we look forward.
Therefore, what follows is an exploration of inflation and the relative value of various asset classes.
With that, let us begin.
Section 1: Inflation Dominates
As the world is now painfully aware, inflation has been, and remains, the dominant macroeconomic theme of 2022. After years of declining inflation (and commensurately declining interest rates), pent-up demand, constrained supply, and a massive increase in monetary and fiscal stimulus caused the largest spike in inflation in the United States in 40-year highs. Frustratingly, despite some thoughtful policy moves by the Federal Reserve following that realization, inflation has remained stubborn in returning to lower levels.
Chart 1 shows just how large those moves have been.
Chart 1: Annualized Inflation Rate (12-month % change in CPI), January 1987 through June 2022[1]
[1] Source: Federal Reserve of St. Louis, MassMutual WMIT Research, as of September 23, 2022
As the chart demonstrates, over the past 40 years, inflation has bounced between -2% (during the financial crisis) and 6%, and recently spiked to 8.5% (end of June), only to fall to 7.8% in August.
We have explored in previous updates why this matters, but three of the more notable reasons are as follows:
1) Higher prices of goods and services mean consumers have to spend more to get the same amount or will use the same dollars to buy less.
2) Higher inflation rates will generally mean that cash loses its purchasing power faster. If I have $100 today and can purchase $100 of goods, in a year, I will only be able to purchase $92 of goods with inflation at 8%.
3) Higher inflation rates make planning difficult because prices can be unstable and unpredictable. Therefore, our central bank (the Federal Reserve) tries to ensure prices are stable (part of their dual mandate: stable prices and full employment). Doing so requires the Federal Reserve to raise rates (among other things), which, by definition, slows the economy as a) borrowing becomes more expensive, and b) future cash flows are worth less since the discount rate is now higher.
Therefore, while we have explored all of these in finer detail in previous updates, essentially, we know 1) inflation has been rising and remains high, and 2) higher inflation can result (through various mechanisms) in a slower economy.
And this is essentially what markets are reacting to.
Both the stock market and the bond market are wondering a) how far will the Federal Reserve have to go to stop inflation, and b) how much will those moves hurt the economy?
While the answer is complicated (and unclear) for many reasons, it does force us to ask an important question: What, as investors, are we supposed to do as this plays out?
Should we sell everything and rush to cash? Should we try and time the market? Is now the time for alternative assets? A neighbor told me I should buy gold—is now the time?
To help answer those questions, just as we used various perspectives during the watch allegory, let us explore some perspective on where and how we explore current value.
Section 2: The Consideration of Value
Bear with me for a moment.
When we buy the S&P 500, what are we really buying? Well, despite all the noise, all the jargon, all the complexity, and all of the experts, we are really just buying a small piece of ownership in each of some of the 500 largest companies in the United States.
That’s it. Buy the index, and you now own a small portion of companies such as Apple, Visa, Coca-Cola, Exxon Mobile, and Microsoft.
Every day, the fine people at those companies come in and do their jobs. They try and make good strategy decisions, they try and develop new products, and ultimately, they try and generate profits for shareholders by charging more for the product they create than the cost of making and selling that product.
Over time, those companies that are successful will generate profits and grow their companies, and those companies that are not successful will eventually not generate profits, and their companies will either stagnate or shrink.
And yet…
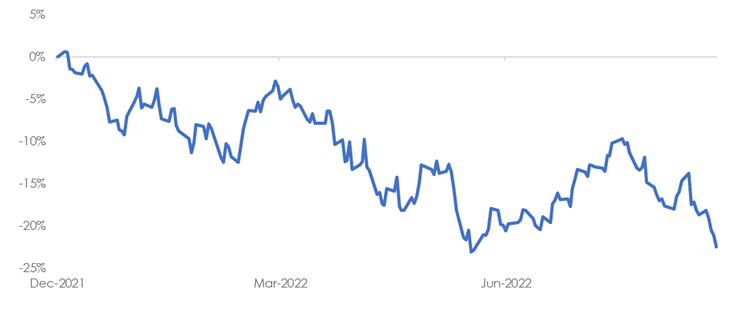
Turn on the financial press, and Chart 2 is generally what you see.
Chart 2: Standard & Poor’s 500 Cumulative Total Return (2022 YTD)
Source: Bloomberg, MassMutual WMIT Research, as of September 23, 2022
What a terrifying chart. Stocks have had one of the most difficult first eight months of the year in decades, and investors are inundated with that fact daily.
First, let’s breathe. Second, let’s recognize that, over history, we have endured far worse time periods, far higher inflation, and far more difficult environments.
Third, let us explore our options.
#1 – Cash
If an investor were to sell and move to cash, there would be four primary implications: 1) the investor would guarantee they would be locking in the losses for the year (see Chart 2 above), 2) they would lose all opportunities for further gains, 3) they would incur (often meaningful) taxes and expenses, and 4) they would be guaranteeing a loss of purchasing power over the next year as inflation is high and yields on cash are not.
Hmmm…not such a great option, particularly given how incredibly difficult it is to “time markets.”
#2 – Bonds
As you might be aware, bonds have gone down this year, and, by definition, the yields on those bonds have commensurately risen.
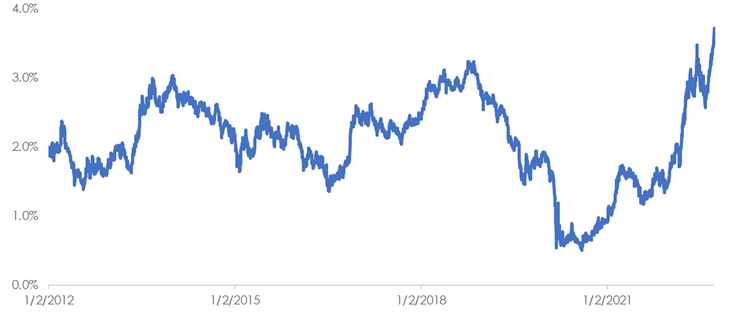
This brings us to Chart 3.
Chart 3: United States 10-Year Treasury Yield
Source: Bloomberg, MassMutual WMIT Research, as of September 23, 2022
Chart 3 shows the yield on the United States 10-year government bond. While it has gone a bit unnoticed, this is literally yielding the highest rate in many years. If one were to buy a treasury bond from the U.S. government today and hold it until maturity, that investor would receive nearly 4% per year.
While this pales in comparison to the inflation of 8.5%, it is clearly a large improvement in yield relative to the past several years and is worth noting.
#3 – International Stocks
While this is a topic for a separate update entirely, I generally do not see meaningful incentives for U.S. investors to make large or increasing allocations to international equities (or bonds, for that matter). While there are exceptions, Europe has significant monetary, fiscal, and geopolitical headwinds, Asia has material challenges regarding growth and capital controls (although Japan has some really unique decisions right now), and Central and South America have significant idiosyncratic issues (depending on the country), along with some concerns about inflation and USD-denominated debt. Said another way, at a minimum, I see no justification for an overweight to the international space.
#4 – U.S. Stocks
And now we come to the U.S. stock market. If you, dear reader, are U.S.-based, you are inundated with a daily barrage of negative news on the economy, inflation, and stock markets, in particular. Unfortunately, those stories sell, and, as investors, it’s our job to remain rational despite the emotional response that often comes from bad news.
Let us try and take a more methodical approach to determining how expensive or inexpensive these assets are.
You may have heard of a measure called “P/E,” which stands for price to earnings. The basic calculation takes the price of a company (say $100) and divides that number by the earnings of the company (say $5) in a single year. So, that hypothetical company would have a P/E of 20 (100 divided by 5). Make sense?
We can also do the same calculation with an index. We can add up the total prices (or market values), for example, of all S&P 500 companies, and we can add up the total earnings for all S&P 500 companies, and we can divide one by the other. Turns out, somewhat coincidentally, the P/E of the entire stock market is around 19.
So what? Well, not much. Yet.
It’s difficult to compare the number 19 with bond markets, for example, or with cash, or real estate.
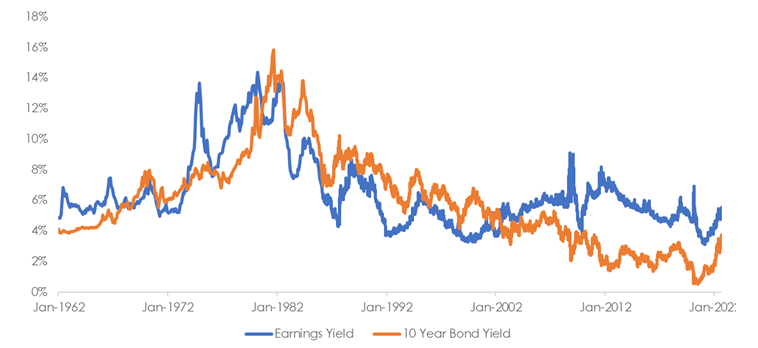
As investors, we generally make relative choices, not absolute choices, and a number like 19 doesn’t tell us much. But we can take the number and invert it, so a number like 20 is now 1/20, or 5% (which is something we can refer to as the “earnings yield”).
That information is now shown in Chart 4.
Chart 4: United States 10-Year Treasury Yield vs. S&P 500 Earnings Yield
Source: Bloomberg, MassMutual WMIT Research, as of September 23, 2022
Accordingly, this perspective now gives us the ability to compare U.S. government bonds to the S&P 500 Earnings yield, as well as compare both to their own histories.
This gives us several takeaways:
1) The “yield” on both stocks and bonds is materially higher than it was in the past several years (e.g., from this perspective alone, the assets are a better deal than they were).
2) The yield on stocks is higher than it is on bonds…which, at the margin, continues to mean stocks are relatively attractive.
3) Lastly, the yield on bonds has jumped from the all-time lows in October of 2020 and is now yielding something much more meaningful.
Does that mean we should rush out and buy both? Or either?
Not necessarily, but it does mean that if bonds and equities were a useful allocation to investors a year or two ago (as they are for most), then they are, at least from this perspective, now an even better deal.
With that, let us summarize:
1) Inflation is high but is beginning to slow, and we believe the Fed is finally focused on the right problem and using the right toolbox. They have a difficult job to do with significant risks, and we therefore generally do not believe this is the time to move out far on the risk curve.
2) Buying a stock is quite literally becoming an owner of a company, and the incentives for those companies have not changed. Yet the market reaction to the Fed withdrawing liquidity is both painful, logical, and necessary. The short-term is often confusing and painful, while the long-term, for those who can maintain their plan and focus, can offer rewards.
3) As public markets have fallen, the yields on those assets have risen, and in many ways, those assets are more attractive than they were in recent time periods. That is an important statement when contemplating what to do with our existing portfolios, and in trying to focus on long-term decision-making.
Lastly, in closing, please remember we continue to watch the markets closely, and we are here to serve you. Take a moment to breathe…we will get through this difficult time.
We remain at your service.
Daken J. Vanderburg, CFA
Head of Investments, Wealth Management
MML Investors Services
Asset allocation and diversification does not guarantee a profit or protect against loss in declining markets. There is no guarantee that a diversified portfolio will outperform a non-diversified portfolio or that diversification among asset classes will reduce risk. Investing involves risk, including the possible loss of principal. There are no guarantees an investment’s stated objective will be achieved.
This material does not constitute a recommendation to engage in or refrain from a particular course of action. The information within has not been tailored for any individual. The opinions expressed herein are those of Daken J. Vanderburg, CFA as of the date of writing and are subject to change. MassMutual Trust Company, FSB (MassMutual Trust) and MML Investors Services provide this article for informational purposes, and do not make any representations as to the accuracy or effectiveness of its contents. Mr. Vanderburg is an employee of MassMutual Trust and MML Investors Services, and any comments, opinions or facts listed are those of Mr. Vanderburg. MassMutual Trust and MML Investors Services, LLC (MMLIS) are subsidiaries of Massachusetts Mutual Life Insurance Company (MassMutual).
This commentary is brought to you courtesy of MassMutual Trust and MML Investors Services, LLC (Member FINRA, Member SIPC). Past performance is not indicative of future performance. An index is unmanaged and one cannot invest directly in an index. Material discussed is meant for informational purposes only and it is not to be construed as specific tax, legal, or investment advice. Although the information has been gathered from sources believed to be reliable, it is not guaranteed or independently verified Please note that individual situations can vary, therefore, the information should be relied upon when coordinated with individual professional advice. Clients must rely upon his or her own financial professional before making decisions with respect to these matters. This material may contain forward looking statements that are subject to certain risks and uncertainties. Actual results, performance, or achievements may differ materially from those expressed or implied.
Securities, investment advisory, and wealth management solutions offered by MML Investors Services, LLC member SIPC, a registered broker-dealer, and a registered investment adviser.
If customization is at the producer-level DBA, insert DBA name where noted below and then delete these instructions. Otherwise, please delete this entire section: DBA Name is not a subsidiary or affiliate of MML Investors Services, LLC or its affiliated companies.
©2022 Massachusetts Mutual Life Insurance Company, Springfield, MA 01111-0001 All Rights Reserved. www.massmutual.com
MM202509-302997


