October 2024 - Investing Through Election Season
By: Kyle McBurney, CFP
Managing Partner at Highland Peak Wealth

“Kyle, sell everything—our country is going to hell in a handbasket.”
I’ll never forget that call. Following Obama’s reelection in ’12, my client, a die-hard Texan, had hit his breaking point. We sparred back and forth for what felt like ages until I finally, and reluctantly, caved. Maybe I was too green in the business, or maybe I just didn’t have the courage to push back hard enough—but I’ve never forgiven myself for not changing his mind. As his advisor, I failed him. His investments were sold, his cash was sent out.
Back then, the S&P 500 sat at 1,410.
Today? It’s soaring at 5,700. Ouch.
“Kyle, I’ve had enough. Sell everything. I’m moving to Scotland.”
That was 2016, just a week after Trump’s surprise victory. But this time, I was ready. We talked it through, and she decided to stay invested. The S&P was hovering around 2,000. If she’d pulled out, it would’ve been a seven-figure mistake.
“Kyle, I’m out. Sell everything. I’m moving to Portugal.”
Fast forward to 2020 and I got nearly the same call. The markets were wild, nerves were frayed, but we were ready. Our team worked hard to keep the client invested. He stayed in the market, although it was difficult to argue against the allure of Portugal.
You get the point. Elections stir emotions—they always have, and they always will. But we urge you not to let short-term noise derail long-term plans. A long-term view is especially difficult in today’s world, with 24-hour news and social media amplifying every twist and turn.
As we’ve said before, first and foremost, breathe.
Of course, there are plenty important reasons to be voting this November. However, the stock market, in our view, isn’t one of them.
Letting politics get in the way of a long-term investment plan has been extremely costly to investors. Each election season I still think of my client from Texas who likely missed out on so much.
According to Bespoke Investment Group, investing independent of political party is vital. Going back 70 years, $1,000 invested only when a Republican is President would be worth $27,400 today. Conversely, $1,000 invested only when a Democrat is President would be worth double that, around $61,800. But, $1,000 invested the entire time would be worth a staggering $1.7 million.
The lesson? Don’t base your investment strategy on the occupant of the White House. Market fundamentals, not political parties, drive the stock market. Policies may influence the economy but remember: the economy (and White House) is not the stock market.
This brings us to Admiral Nelson. During the Battle of Copenhagen in 1801, his commander, the overly cautious Admiral Sir Hyde Parker, from his ship, hoisted the signal for all boats to retreat as casualties were mounting. Nelson, known for his boldness, lifted his telescope to his blind eye and declared, “I really do not see the signal.” He ignored the order and pressed on. The battle was won, Nelson’s reputation was solidified, and the phrase turn a blind eye was born.
As the election approaches, expect plenty of noise and volatility. Check your portfolio if you must, but we suggest you follow Nelson’s example and look with your blind eye. History has shown time and time again that markets eventually find their course. Stay focused and keep the long-term view. Let’s focus on what truly matters: building wealth and achieving your financial goals, no matter who the President is.
Election Season and Market Returns
For investors, it is easy to speculate how their portfolios fare under different administrations. But, as history shows, focusing too much on who wins or who loses can be more distracting than helpful. In this edition of the Trail Guide, we want to highlight three critical questions:
Do markets favor one party over the other?
Is a divided government better for stocks?
What changes with a Trump or Harris win?
So, let's examine the relationship between elections, political parties, and stock market performance.
Do Markets Favor One Party Over the Other?
The short answer is yes, although we caution against placing too much weight on this. Despite what headlines might suggest, presidents and politicians overall have less direct control over the stock market than most people think.
According to Bloomberg, from 1926 to 2023, the S&P 500 produced an average annual return of 14.78% under Democratic presidents and 9.32% under Republican presidents—a notable 5.5% yearly difference. While this might lead some to conclude that one party is more "market-friendly" than the other, these numbers are shaped by a unique mix of economic and geopolitical factors that go beyond party labels.
The story changes depending on how the data is sliced. For example, if we exclude the disastrous tenure of Republican President Herbert Hoover during the Great Depression, the gap between parties narrows significantly. Below you will see the mean and median returns of Democratic (Blue) and Republican (Red) presidencies since 1950:
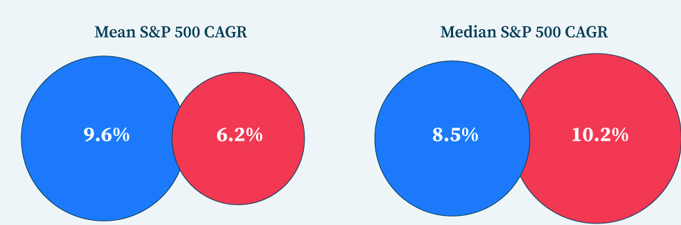
Source: Yahoo Finance 8/13/2024
Is a Divided Government Better for Stocks?
Of course, Presidents alone cannot pass laws and enact policy changes. That requires help from Congress. Currently, markets are pricing in a split Congress, with the Democrats gaining the House and the Republicans winning the Senate. It is not a given, of course, but it looks more and more like the probable outcome. So, whoever wins the White House will likely have to deal with a divided government. It's a setup for classic D.C. gridlock.
Most in the industry like a split Congress, which tends to reduce the risk of extreme policy changes that could disrupt the economy. Historically, divided governments have been associated with solid stock market returns, as politicians often struggle to pass sweeping reforms. The chart from YCharts below confirms this trend:
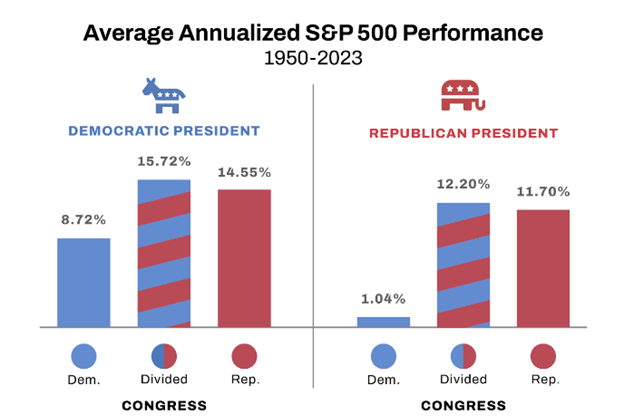
Source: Ycharts
But divided government isn't just a quirk of recent times—it's now the norm. Since 1950, Congress has been split between the two parties more than twenty times. According to Carson Investment Research, between 1951 and 2013, the S&P 500 delivered an average annual return of:
6.7% when Democrats controlled Congress,
11% when Republicans held both houses and
14.5% during split Congresses
Remember, though, that past performance is no guarantee of future results, and what goes on in the legislative branch isn't nearly as important to stocks as underlying business fundamentals or the financial success of the companies and industries that make up our stock market.
Trump vs. Harris
To be clear, we have no idea how the election will play out, nor do we have any interest in dissecting polls or political momentum. Our job, as always, is to remain laser-focused on markets. While at the macro level markets will do what they do, regardless of who wins, we do recognize that some sectors will benefit more than others depending on the outcome.
Dan Clifton, Head of Washington Policy Research at Strategas, is one of the top experts in connecting the dots between markets and D.C. politics. Earlier this year, Dan and his team outlined a thematic portfolio for each candidate, highlighting the sectors that could benefit most depending on the election results. While we typically avoid recommendations on individual stocks, these broader themes are insightful for understanding potential shifts.
Harris Portfolio
In alphabetical order to avoid any hints of bias, let’s start with Vice President Harris’s portfolio. It closely resembles the Democratic basket from 2020 but with a few noteworthy additions:
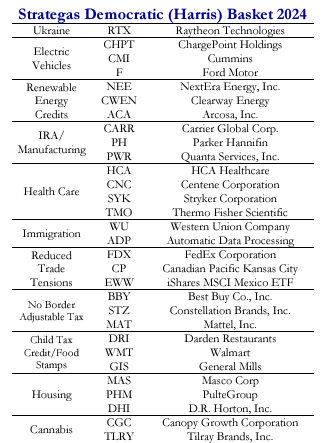
Source: Strategas
The most noteworthy change, in our opinion, is the addition of manufacturing and defense contractors. Ukraine/Defense is especially interesting. The equity market appears to be taking Trump's word that he will end global conflicts. As such, defense stocks rallied as Harris' odds of winning gained ground in polls after the September 10 debate.
Outside of industrials and defense, the healthcare sector may benefit—less because of new policies and more due to the status quo, such as maintaining affordable healthcare. Per Dan Clifton at Strategas, Hospitals, Medicaid, HMOs, and Life Sciences are all set to potentially benefit from a Harris victory.
Trump Portfolio
Trump's portfolio has a familiar ring, echoing his themes of tariffs, energy, and immigration enforcement.
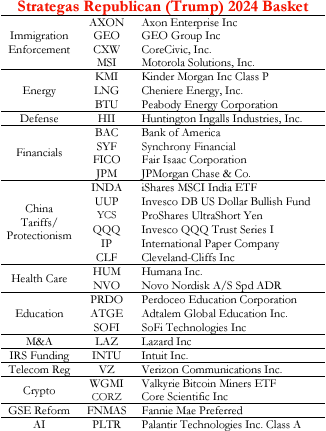
Source: Strategas
There are, however, some interesting nuances:
- India potentially is more attractive if relations with China worsen
- Trump seems to have won the Crypto narrative
- Artificial Information Technology may benefit
The AI theme is striking. Equity markets see Trump as a better defender of Taiwan. A more stable Taiwan leads to a more stable semiconductor industry. Notably, semi stocks have lagged as Harris has improved her standing.
A Quick Word on Tax Changes
With key provisions of the 2017 Tax Cuts and Jobs Act (TCJA) set to expire in 2025, taxes are expected to be a top priority for the next administration. However, neither candidate has released a fully detailed tax plan, leaving Wall Street to speculate on what might come.
Of course, so much of this policy battler remains unknown. It would be risky to assume these changes could be implemented, especially with a split Congress. We remain even more skeptical about changes to capital gains. They appear to be deeply unpopular with Republicans as well as moderate Democrats. As more details emerge, we’ll continue to analyze how these proposals could impact different market segments. Also, we will work closely with your tax advisor to ensure that you remain ahead of the curve.
Chart of the Month – Pumping gas getting cheaper likely to play a big role at the polls

Source: Strategas
Bonus Chart – Here is what we wish candidates were focusing on: national debt and interest payments.
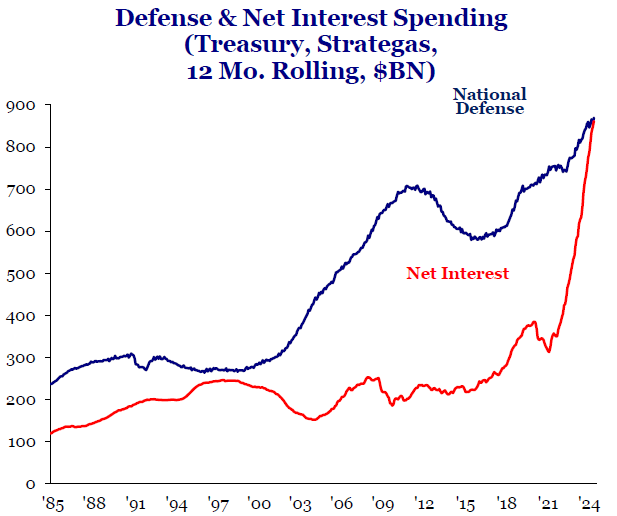
Source: Strategas
Allocation Update
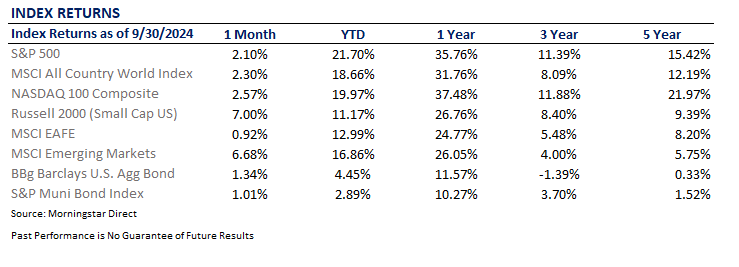
The S&P 500 wrapped up the month and quarter on a solid note, shaking off a volatile September to end at record highs. Fed Chairman Jerome Powell’s comments about a more cautious pace of rate cuts initially rattled the markets, hinting at 50 basis points in cuts by year-end instead of the expected 75. However, markets swiftly recalibrated. By the end of the month, the S&P 500 posted a 2.10% gain for September and a robust 5.53% for the quarter, while the Dow and Nasdaq logged similar strength.
While much of our focus recently has been on the upcoming election, we can’t ignore the broader developments that fueled these gains:
A larger-than-expected rate cut
Cheaper gas prices
Cooling inflation
A wave of stimulus out of China sending Chinese stocks on a tear
Looking ahead, we’re closely monitoring factors that could shape the trading environment in the near term. Of course, we will always remain diversified with an eye on risk, but our team will look to tilt and adjust as appropriate. Additional rate cuts, elections, and new economic data may shift our focus toward different sectors and themes.
One area now firmly on our radar is emerging markets. Historically, these markets have underperformed, with China being the most significant component and a notable laggard. Per Morningstar Direct, the emerging market index has trailed US markets 7% over the past three years. But that dynamic may be shifting.
On September 24th, the People’s Bank of China (PBOC) introduced aggressive measures, including slashing interest rates, lowering mortgage rules, and injecting liquidity into the system. These moves sparked a dramatic 9.1% single-day rally in the CSI 300 Index—its biggest jump since 2015—and resulted in a 21% gain for the month overall.
Could this be the turnaround we’ve been waiting for? It’s too early to say definitively, but we’re watching closely and will keep you updated as the story unfolds.
As always, here’s a quick snapshot of our outlook:
Equities – Balanced Approach:
U.S. Stocks Still Preferred: For now, our inclination continues towards U.S. equities over international markets, but emerging markets have become more interesting.
Small Caps Rallying? Small-cap stocks have been impressive of late and have benefited by rate cuts. More to come?
Developed International: Solid returns but looking for more momentum and trend.
Emerging Markets: India continues to be a standout, but China’s rally has our full attention.
Fixed Income – Slightly Underweight (with increased focus):
Long-Term Bonds: We continue to seek longer-term bonds to lock in the higher yields currently available. With rates moving lower, now may be the time.
Floating Rate Bonds and CLOs: Yields remain strong, but a closer look is warranted as rates fall.
Alternatives – Slightly Underweight
Gold Overweight: As with stocks, Gold had a strong ’23 and is enjoying a fantastic ’24 (up ~28.4% per Koyfin).
Growing Interest in Private Alternatives: Where applicable, our team expects to utilize private investments more meaningfully moving forward.
Cash – Getting Closer to Neutral
Strategic Use of Cash: Yields have become less attractive as rates fall.
As advisors, we feel fortunate to work with so many inspiring clients. Our team is, in some ways, in a unique position. We have the privilege of sitting at dining room tables across the country, engaging in deep conversations on a wide range of topics. Despite our clients being all over the political spectrum, we are amazed at the similarities and common ground.
Changing topics, The Extra 2% by financial journalist and sportswriter Jonah Keri is a fantastic book. It explores how the Tampa Bay Devil Rays (later rebranded as the Rays) transformed from one of the worst major league baseball teams to a perennial contender despite being in a small market. Mr. Keri calculated the "extra 2%" as the difference between a winning baseball team and a losing one—a shockingly small number given all the variables involved.
From our humble perch, the difference between the average Republican and Democrat voters is even less. Call us optimists, but we see far more similarities than differences.
So, as election season heats up, remember to focus on what truly matters. And if you feel the need to check your portfolio, feel free, but consider taking a cue from the legendary Admiral Nelson and use that "blind eye" of yours!
We hope that you have had an excellent start to the fall. Our team thanks you for your support, trust, and readership.
Kyle M. McBurney, CFP®
Managing Partner
CRN202710-7280955
The opinions expressed herein are those of Kyle McBurney, CFP as of the date of writing and are subject to change. This commentary is brought to you courtesy of Highland Peak Wealth which offers securities and investment advisory services through registered representatives of MML Investors Services, LLC (Member FINRA, Member SIPC). Supervisory office: 280 Congress Street, Boston, MA 02210. (617)-439-4389. Highland Peak Wealth is not a subsidiary or affiliate of MML Investors Services, LLC or its affiliated companies. Past performance is not indicative of future performance. Information presented herein is meant for informational purposes only and should not be construed as specific tax, legal, or investment advice. Although the information has been gathered from sources believed to be reliable, it is not guaranteed. Please note that individual situations can vary, therefore, the information should only be relied upon when coordinated with individual professional advice. This material may contain forward looking statements that are subject to certain risks and uncertainties. Actual results, performance, or achievements may differ materially from those expressed or implied. This material does not constitute a recommendation to engage in or refrain from a particular course of action. Referenced indexes, such as the S&P 500, are unmanaged and their performance reflects the reinvestment of dividends and interest. Individuals cannot invest directly in an index.
Glossary of Index Definitions
Indexes are unmanaged, do not incur fees or expenses, do not reflect any deduction for taxes, and cannot be purchased
directly by investors.
The S&P 500® Index is a widely recognized, unmanaged index representative of common stocks of larger capitalized U.S. companies.
The S&P Muni Bond Index is a broad, market value-weighted index that seeks to measure the performance of the U.S. Municipal bond market.
Dow Jones Industrial Average is a price-weighted average of 30 actively traded Blue Chip stocks, primarily industrials, but also including other service-oriented firms; may be used as a benchmark for large cap stocks
NASDAQ Composite is a broad-based index of over 3,000 companies, which measures all domestic, and non-U.S.-based common stocks listed on the NASDAQ Stock Market, Inc.
The NASDAQ 100 U.S. Index is a composed of the 100 largest, most actively traded U.S. companies listed on the Nasdaq stock exchange.
The Russell 2000® Index is a widely recognized, unmanaged index representative of common stocks of smaller capitalized U.S. companies.
The MSCI EAFE Index is a widely recognized, unmanaged index representative of equity securities in developed markets, excluding the U.S. and Canada.
The MSCI Emerging Markets (EM) Index is an unmanaged market capitalization-weighted index of equity securities of
companies domiciled in various countries. The Index is designed to represent the performance of emerging stock markets
throughout the world and excludes certain market segments unavailable to U.S.-based investors.
The MCSI All Country World Index (ACWI) captures large and mid cap representation across 23 Developed Markets and 24 Emerging Markets.
The Barclays U.S. Aggregate Bond Index is a broad measure of the U.S. investment-grade fixed-income securities market.
The Bloomberg U.S. Aggregate Bond Index is an unmanaged index of fixed-rate investment-grade securities with at least one year to maturity, combining the Bloomberg U.S. Treasury Bond Index, the Bloomberg U.S. Government-Related Bond Index, the Bloomberg U.S. Corporate Bond Index, and the Bloomberg U.S. Securitized Bond Index.
The Nikkei Index is a price-weighted index composed of Japan’s top 225 blue-chip companies traded on the Tokyo Stock Exchange.
©2023 Morningstar, Inc. All Rights Reserved. The information contained herein: (1) is proprietary to Morningstar and/or its
content providers; (2) may not be copied or distributed; and (3) is not warranted to be accurate, complete or timely. Neither Morningstar nor its content providers are responsible for any damages or losses arising from any use of this information