

September 2024 - The Market Abides (For Now)
By: Kyle McBurney, CFP
Managing Partner at Highland Peak Wealth

For those who don’t know, I played a little college basketball back in the day. Before you get too excited, let me clarify: my limited athleticism and decent jump shot landed me at Kenyon College, a small Division III school in Ohio. One of the charms of playing at a smaller school is that you get all the time commitment of a big-time program, but without the perks.
One constant reminder of this was the bus. Unlike Division I teams that travel in style on charter airplanes, we made do with old Greyhound buses that had seen better days. They weren’t much to look at, but they got us where we needed to go—and hey, they even had a TV and VCR. For us, that was enough.
As we traveled around the Midwest and, occasionally, the East Coast, we had a rotation of three movies on repeat. The movie most often played was the cult classic, The Big Lebowski, with Jeff Bridges playing laid-back Jeff “The Dude” Lebowski. In the movie, the Dude is constantly pulled into complicated situations, even though his laid-back nature makes him the least likely person to be involved in anything stressful. Despite the pressure to act and solve problems—like retrieving a ransom or finding a missing person—the Dude rarely does much, and somehow, things just work out for him. His passive, "go with the flow" approach helps him survive chaos without breaking a sweat.
“The Dude” was likely a fantastic investor.
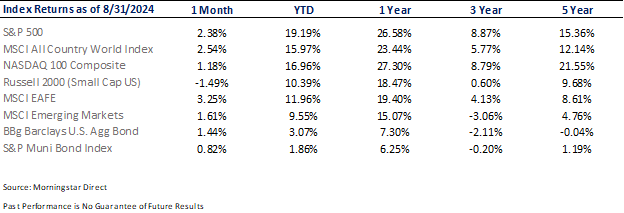
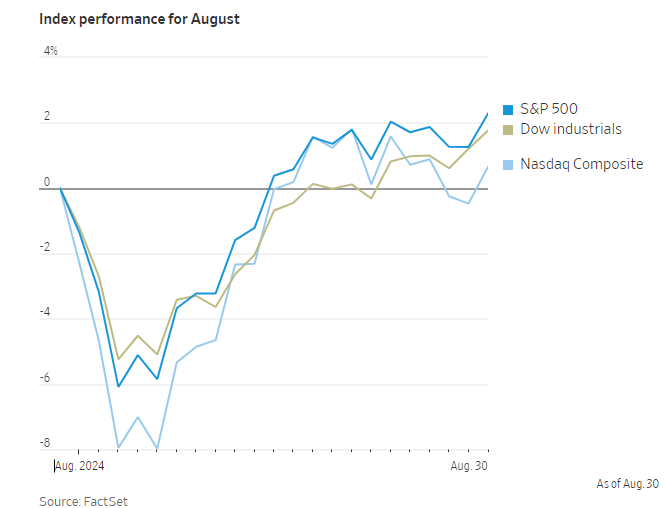
As hurricane Debby arrived in early August, markets were also swirling. Thrown off by soft employment and manufacturing data, whispers of slowing growth and recession took off. At the same time, Japan’s stock market as a popular currency hedge imploded, creating forced selloffs at hedge funds and institutions. Simply put, things escalated, and escalated quickly. According to Bloomberg, the S&P 500 fell 6% and the tech heavy Nasdaq 100 index dropped 11% seemingly overnight. 2024’s stock market calm evaporated.
The market chaos in early August reminded me of past market selloffs. Even seasoned investors can get swept up in the anxiety of it all. Pessimism often feels more convincing than optimism, and the media knows how to play into that. It's tempting to react and “do something” just to feel like you have control. But this is where many investors fall into a trap: acting out of fear often hurts portfolios more than it helps.
During the recent market sell off, I came across an article from 2011 that features what Jack Bogle, legendary investor and founder of Vanguard, said to investors during the aftermath of the Great Recession.
"My rule—and it's good only about 99% of the time, so I have to be careful here—when these crises come along, the best rule you can possible follow is not "Don't stand there, do something," but "Don't do something, stand there!" said Bogle.
As the month progressed, markets recovered slowly and then quickly. Add it all up, and August amazingly produced positive returns across the board. Patient investors, and those like “The Dude,” were well rewarded. Despite the noise, the S&P 500 closed higher and just 0.35% away from an all-time closing high. Even the Nasdaq was able to recover and eek out a positive gain for the month.
To summarize, August gave investors a healthy lesson: In the markets, and in life, it is best to fight the urge to “do something” just for the sake of doing something. Yes, “protecting” your portfolio may have made you feel better, but it would have been at the expense of your portfolio. Volatility is the price of admission for investing in equities—history shows us that those who remain calm are often rewarded in the long run. Develop a plan and stick to it.
Pullbacks are the Norm
Let me say it once more (and I’ll probably say it a thousand more times): pullbacks are normal.
In fact, what happened before August's volatility was the unusual part. We had seven months of steady market gains, which is quite rare—even in a bull market. Markets simply don’t go up in a straight line forever. So while the recent decline came on fast, it only took a couple of weeks for the markets to recover.
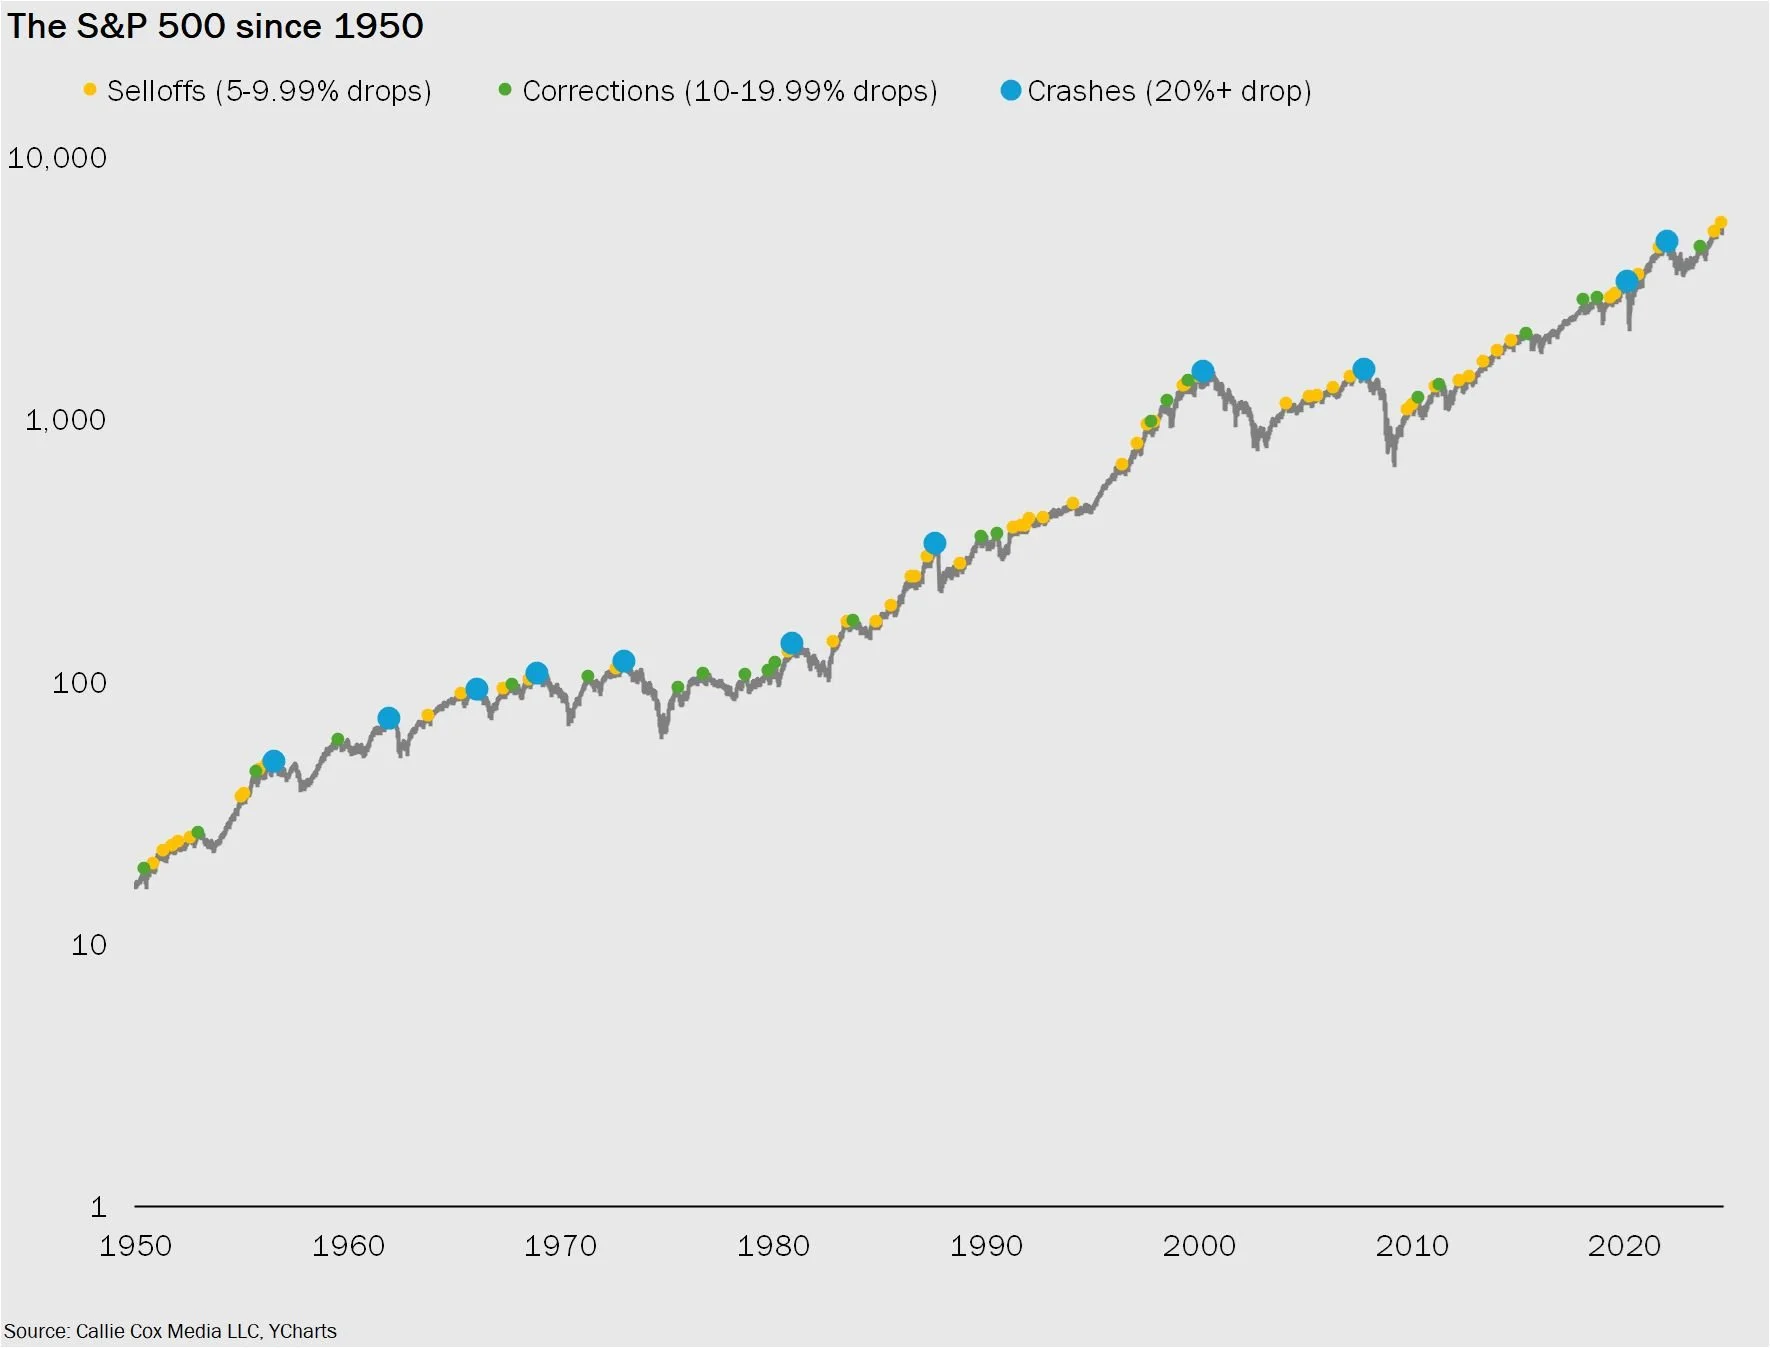
Historically, according to Ritholtz Wealth Management, the U.S. stock market experiences a correction almost every year. A 5% downturn is almost guaranteed, and two-thirds of the time since 1928, we’ve seen double-digit drops. On average, the annual decline is about 16%, so by historical standards, August’s pullback was relatively mild.
No one can predict exactly what’s next, but here’s where we are: The S&P 500 is still up nearly 20% for the year. While the recent drop wasn’t fun, it’s important to remember that corrections are a normal part of the market, even in years that finish strong. In fact, half of all years with positive returns have also seen double-digit drops along the way. It’s just part of what investors need to weather.

A September to Remember?
At least this was the term used by Chris Verrone at Strategas to describe what is shaping up to be a very busy month ahead. September is loaded with financial and political catalysts:
September 10: 2nd Presidential Debate
September 15-30: $250bn Tax Squeeze
September 16: Early voting beings in PA
September 18: Fed Meeting (rate cut expected)
September 18: Trump sentencing for NY conviction
Buckle up.
The way we see it, two key themes are converging this September: seasonality and the presidential cycle.
1) Seasonality
As August wraps up the summer season, it seems like the stock market might be ready to take its own break. As the saying goes, markets tend to fall in fall.
Looking ahead, it's important to highlight a historical trend: Over the last 95 years, September has consistently been the worst month for the stock market in terms of seasonality. Not only do stocks regularly underperform, but it is also usual to see negative returns. On average, it’s the only month with negative returns over 1% (-1.17%, according to FactSet).
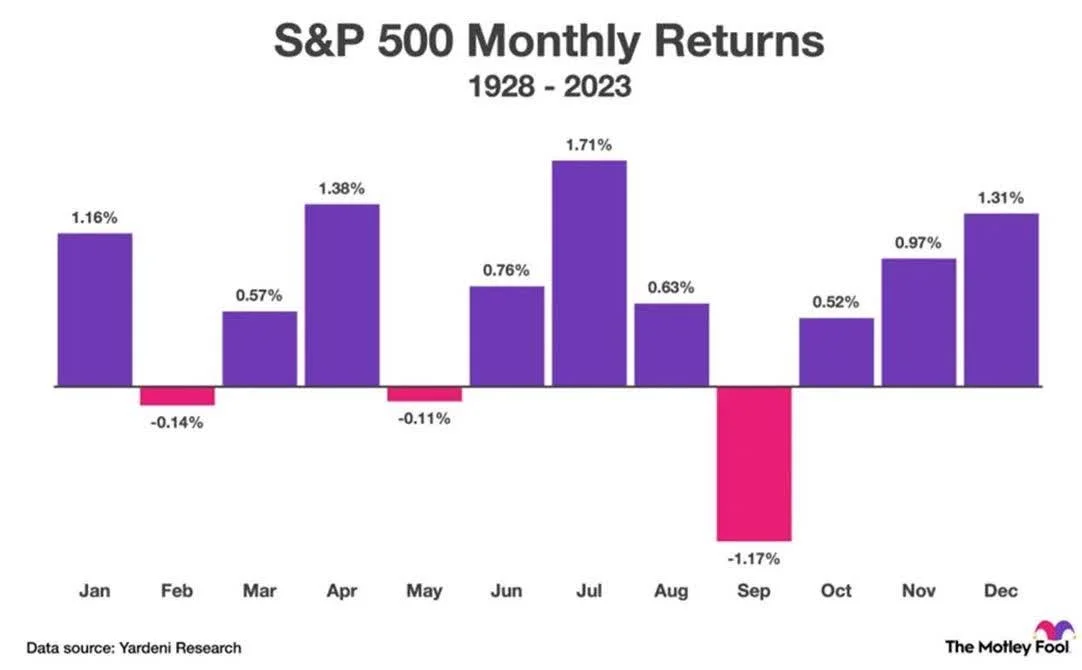
Data from CME Group shows that over the past century, the S&P 500 has lost ground in 55% of Septembers. More recently, this trend has been even more pronounced. Per Ycharts, the S&P 500 has averaged a 2.3% decline over the past ten years. Moreover, markets have declined in four straight Decembers.
September often brings a lot of news and activity that we tend to ignore during the summer, even if we’re not actually on vacation. As investors start paying closer attention again, there’s a higher chance of overreacting to negative news. Regular updates like earnings reports and central bank announcements suddenly feel more important, which can lead to bigger market reactions.
This time of year tends to bring a surge in trading activity after Labor Day, as Wall Street returns from summer vacation. During the summer months, trading volume averages 15.2 billion shares, but in September, that number jumps to 17.2 billion, according to SoFi’s Liz Young Thomas.
More activity often means more volatility, and in September, those big market swings tend to lean toward the downside.
It’ll be interesting to see how September unfolds. Will it recover like August did after early losses? Or will it follow the pattern of past Septembers and continue its long history of underperformance?
Throw in the upcoming election, it is likely to be an even more interesting month for markets.
2) Presidential Election Cycle
Here we go again!
In past Trail Guides, we’ve emphasized that election years aren’t something to fear.
Despite the noise, the stock market typically does just fine. The incumbent party often has several tools at its disposal to support the economy, markets, and overall financial confidence. For instance, the Biden administration has already tapped into resources like the Strategic Petroleum Reserve and the Treasury General Account, (to name a few) to keep liquidity flowing and the economy chugging along.
That said, we are entering a historically choppy period. Since 1950, markets have shown a tendency to get jittery from this point through mid-October, often experiencing minor pullbacks during this time.
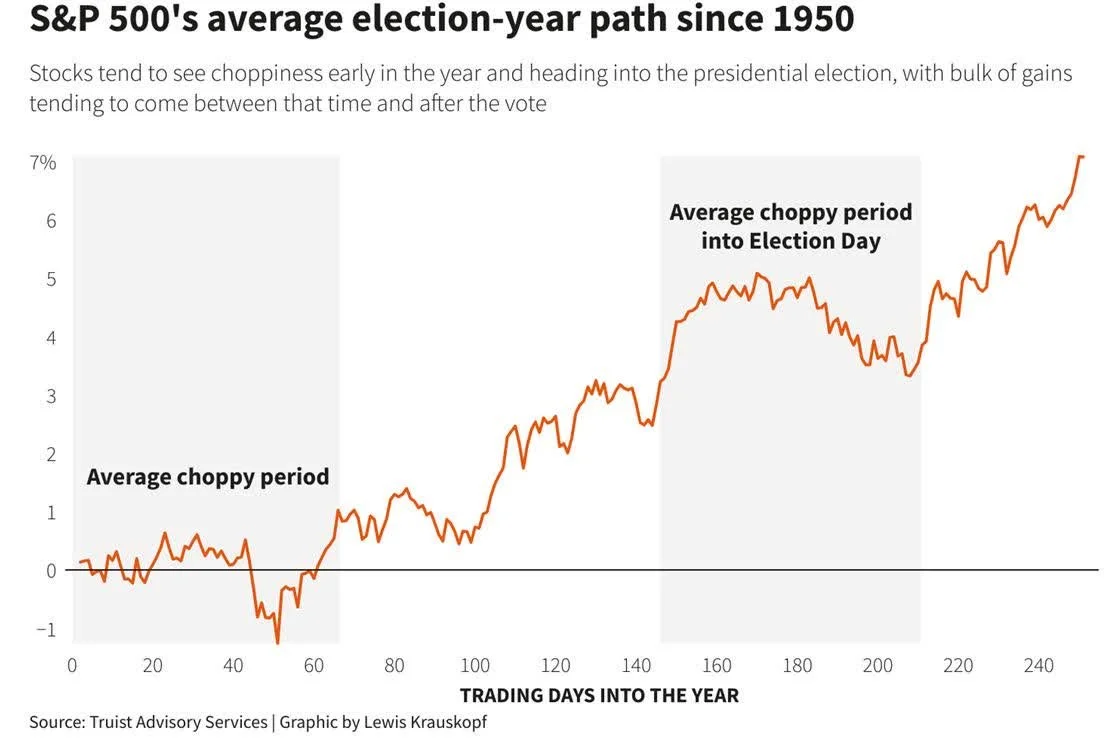
History reminds us that markets get back on track as we get closer to election day. Markets hate uncertainty, and it’s around mid-October when investors get a little more clarity about the likely outcome and policies. Of course, the past provides no guarantees for the future, but deploying cash during the September or October lows has been a very good trade. This becomes even more interesting when a rate cut is on the table.
September Rate Cuts
After a year-long tug-of-war over interest rates, the Fed may finally be ready to make its first rate cut on September 18. Many would welcome a decrease in the Fed's benchmark borrowing rate, which influences lending across the economy.
But how far will the Fed go?
According to the CME Group's FedWatch Tool, traders are pricing in a roughly 59% chance of a 0.25% rate cut and a 41% likelihood of a 0.50% rate cut.
The 0.50% rate cut outcome has gained steam as economic data has been more mixed. New data released on Wednesday showed that U.S. job openings in July dropped to their lowest level in 3½ years, indicating that the labor market may be slowing down—a trend that rattled markets last month.
Two key reports also on the horizon could shape the Fed's move. The August Employment Report, released on September 6, will give insight into the job market's strength (fewer jobs added but unemployment rate fell), while the Consumer Price Index (CPI) report on September 11 is expected to show cooling inflation. If the employment data suggests ongoing weakness, the Fed might lean toward a bigger rate cut to stimulate growth.
Should these rate cuts indeed come to pass, history has shown us there will be impacts to the market including -
- Movements in money market yields
- Positive aspects of holding longer-dated bonds
- A potential pick up in housing activity
But what about the stock market?
Given recent history, it's easy for investors to feel uneasy. Rate cuts often bring memories of past economic downturns, like during COVID and the 2008 financial crisis. However, rate cuts also have their advantages, especially for businesses and stock valuations. Sectors like banks, REITs, and small-cap companies with significant debt could see benefits from lower borrowing costs. Plus, with bonds and cash offering less attractive returns, stocks often gain appeal, assuming a recession is avoided.
History suggests a reason for optimism. Hartford Funds reviewed 22 instances between 1929 and 2019 where the Fed first cut rates, analyzing how the stock market performed over the following 12 months. The data shows stocks delivered a 17% average return when a recession didn’t follow the rate cut, and even when a recession did occur, stocks still rose by 8%. In all instances, stocks have averaged an 11% gain after adjusting for inflation one year after a rate cut.

The rate cuts of the ‘90s and the returns that followed are particularly noteworthy. During this period, the Fed executed the desired “soft landing”. In ’94 and ’95, Fed Chairman Alan Greenspan hiked interest rates to slow inflation and no recession followed.
Sound familiar?
Once Greenspan and company felt comfortable with inflation, rate cuts were initiated to address economic softening. Per Bloomberg, the rate cuts in June 1995 and September 1998 led to stock returns of 23% and 25% over the next year, respectively.
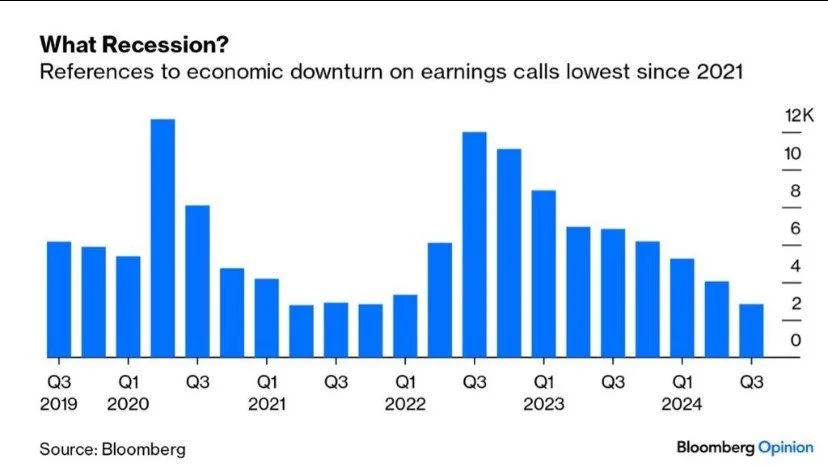
In summary, while rate cuts can signal economic weakness, they have historically provided strong support for stock performance. This gives investors good reason to stay patient through potential volatility. The key question now is whether a recession will occur. While some data has softened, a recession would be surprising, especially since we're not hearing much concern from corporate executives.
Chart of the Month – Recession? Companies barely mentioned the “R” word this past quarter.
A Final August Reminder – Pullbacks are part of the journey. They all feel terrible. They all feel scary. But, since 1950, just 18% turn into bear markets.
Allocation Update
As we mentioned in our previous newsletter, we continue to favor a bit more offense than defense in our portfolios despite September’s shaky track record. Long-term investment plans shouldn’t be adjusted because of seasonal volatility—neither a prudent strategy nor a sound investment philosophy.
Looking ahead, we’re closely monitoring factors that could shape the trading environment in the coming months. Rate cuts, elections, and new economic data may shift our focus toward different sectors and themes. Specific sectors may “win” or “lose” depending on the election's outcome and we’ll be ready to adjust accordingly. We’ll share more on our proposed shifts in next month’s update.
One area that continues to catch our eye is small-cap stocks. After a slow start this year, they’ve been gaining momentum, outperforming the S&P 500 over the past three months. With rate cuts likely on the horizon, we believe these smaller companies—many trading at lower multiples—are well-positioned to outperform their larger peers.
As always, here’s a quick snapshot of our current outlook:
Equities – Balanced Approach:
U.S. Stocks Still Preferred: Our inclination continues towards U.S. equities over international markets.
Small Caps Rallying? As discussed above, small-cap stocks have been impressive of late and deserve our full attention as rate cuts loom large.
Developed International: A solid August, but we are looking for a stronger trend.
Emerging Markets: We maintain a selective approach, with an increasing focus on Indian markets (outperforming the respective benchmark by +14% per Koyfin)
Fixed Income – Slightly Underweight (with increased focus):
Long-Term Bonds: We continue to seek longer-term bonds to lock in the higher yields currently available. This notion has increased as rate cuts become more evident.
Floating Rate Bonds and CLOs: Yields remain strong, but a closer look is warranted as rates fall.
Alternatives – Slightly Underweight
Gold Overweight: As with stocks, Gold had a strong ’23 and is off to a strong start in ’24 (up ~21% per Koyfin).
Growing Interest in Private Alternatives: Where applicable, our team expects to utilize private investments more meaningfully moving forward.
Cash – Getting Closer to Neutral
Strategic Use of Cash: Yields have become less attractive as rates fall.
As summer winds down, our family, like yours, is settling back into the old routine. Well, sort of. Our six-year-old, Teddy, just started kindergarten, so the new schedule of early alarms and bus stop hangouts is now in full swing. So far, so good—Teddy comes home every day as happy as can be. But over Labor Day weekend, he had his own version of the Sunday Scaries, as if life and adulthood was rushing at him too fast.
“I will not go back to Kindergarten!” Teddy declared. “I will not go to college! “I am never getting married!”
Yikes! Careful what you wish for, kid. I think Teddy could use some of Jeff Lebowski’s life lessons (not all, of course). Jokes aside, the McBurney family is doing great and looking forward to the crisp fall weather here in New England. It is a fantastic time of year.
As F. Scott Fitzgerald wrote in The Great Gatsby, "Life starts all over again when it gets crisp in the fall."
As always, thank you for your support and readership.
Kyle M. McBurney, CFP®
Managing Partner
CRN202709-7138375
The opinions expressed herein are those of Kyle McBurney, CFP as of the date of writing and are subject to change. This commentary is brought to you courtesy of Highland Peak Wealth which offers securities and investment advisory services through registered representatives of MML Investors Services, LLC (Member FINRA, Member SIPC). Supervisory office: 280 Congress Street, Boston, MA 02210. (617)-439-4389. Highland Peak Wealth is not a subsidiary or affiliate of MML Investors Services, LLC or its affiliated companies. Past performance is not indicative of future performance. Information presented herein is meant for informational purposes only and should not be construed as specific tax, legal, or investment advice. Although the information has been gathered from sources believed to be reliable, it is not guaranteed. Please note that individual situations can vary, therefore, the information should only be relied upon when coordinated with individual professional advice. This material may contain forward looking statements that are subject to certain risks and uncertainties. Actual results, performance, or achievements may differ materially from those expressed or implied. This material does not constitute a recommendation to engage in or refrain from a particular course of action. Referenced indexes, such as the S&P 500, are unmanaged and their performance reflects the reinvestment of dividends and interest. Individuals cannot invest directly in an index.
Glossary of Index Definitions
Indexes are unmanaged, do not incur fees or expenses, do not reflect any deduction for taxes, and cannot be purchased
directly by investors.
The S&P 500® Index is a widely recognized, unmanaged index representative of common stocks of larger capitalized U.S. companies.
The S&P Muni Bond Index is a broad, market value-weighted index that seeks to measure the performance of the U.S. Municipal bond market.
Dow Jones Industrial Average is a price-weighted average of 30 actively traded Blue Chip stocks, primarily industrials, but also including other service-oriented firms; may be used as a benchmark for large cap stocks
NASDAQ Composite is a broad-based index of over 3,000 companies, which measures all domestic, and non-U.S.-based common stocks listed on the NASDAQ Stock Market, Inc.
The NASDAQ 100 U.S. Index is a composed of the 100 largest, most actively traded U.S. companies listed on the Nasdaq stock exchange.
The Russell 2000® Index is a widely recognized, unmanaged index representative of common stocks of smaller capitalized U.S. companies.
The MSCI EAFE Index is a widely recognized, unmanaged index representative of equity securities in developed markets, excluding the U.S. and Canada.
The MSCI Emerging Markets (EM) Index is an unmanaged market capitalization-weighted index of equity securities of
companies domiciled in various countries. The Index is designed to represent the performance of emerging stock markets
throughout the world and excludes certain market segments unavailable to U.S.-based investors.
The MCSI All Country World Index (ACWI) captures large and mid cap representation across 23 Developed Markets and 24 Emerging Markets.
The Barclays U.S. Aggregate Bond Index is a broad measure of the U.S. investment-grade fixed-income securities market.
The Bloomberg U.S. Aggregate Bond Index is an unmanaged index of fixed-rate investment-grade securities with at least one year to maturity, combining the Bloomberg U.S. Treasury Bond Index, the Bloomberg U.S. Government-Related Bond Index, the Bloomberg U.S. Corporate Bond Index, and the Bloomberg U.S. Securitized Bond Index.
The Nikkei Index is a price-weighted index composed of Japan’s top 225 blue-chip companies traded on the Tokyo Stock Exchange.
©2023 Morningstar, Inc. All Rights Reserved. The information contained herein: (1) is proprietary to Morningstar and/or its
content providers; (2) may not be copied or distributed; and (3) is not warranted to be accurate, complete or timely. Neither Morningstar nor its content providers are responsible for any damages or losses arising from any use of this information
